
How to Adapt Your Strategies for a More Concentrated Altseason
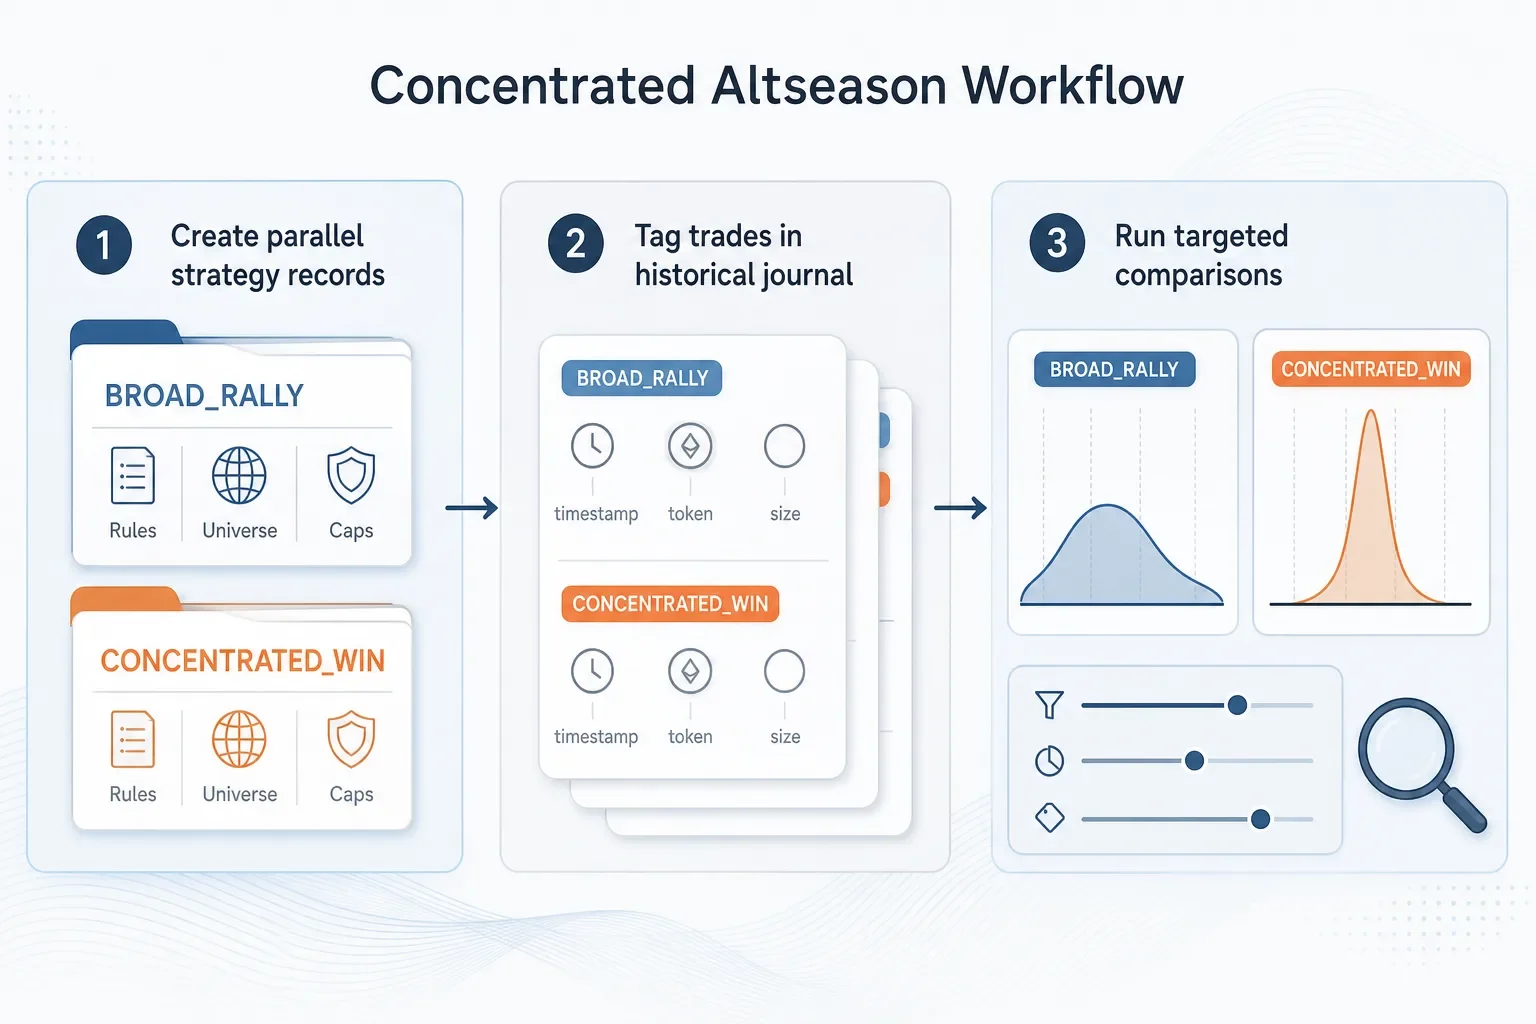
Step-by-step workflow to adapt trading strategies for a concentrated altseason: create regime-specific strategy records, tag outcomes in a historical journal, compare results across token subsets, and apply concentration-aware sizing and monitoring.
# How to Adapt Your Strategies for a More Concentrated Altseason
Altseason cycles can differ: some rallies are broad and diffuse, others concentrate returns into a handful of names that produce outsized, idiosyncratic moves. When winners concentrate, token selection, sizing and monitoring must shift from a diversification-first mindset to one that accounts for single-name dominance and faster regime changes.
This guide gives a practical, step-by-step workflow you can apply now. It shows how to separate regime hypotheses into distinct strategy records, tag and analyze historical outcomes, run targeted comparisons across token subsets and time windows, and implement concentration-aware sizing and monitoring. Templates and concrete examples are included so you can adapt the rules to your universe and risk appetite.
> Note: the procedures below are decision-making and record-keeping techniques. Trade Strategy supports these workflows through Strategy management, a Historical results journal and Strategy comparison tools; use them as decision support, not trade execution or guaranteed performance.
## 1 — Treat regimes as design variables: create parallel strategy records
Instead of forcing a single strategy to work for every market structure, create separate strategy records for your regime hypotheses. Typical labels: BROAD_RALLY and CONCENTRATED_WIN (you can add MIXED for transition periods).
For each record document:
- Strategy objective (e.g., cross-sectional momentum vs concentrated alpha capture)
- Token-selection rules and explicit universe
- Position sizing rules and hard caps
- Rebalance and monitoring cadence
- Entry/exit triggers and stop logic
Why this helps: parallel records make it clear which assumptions drive outcomes. When you see differing results, you know the variation is likely regime-dependent rather than random drift.
Practical example
- BROAD_RALLY record: Universe = top 200 by market cap excluding stablecoins; weekly equal-weight rebalance; cross-sectional momentum filter.
- CONCENTRATED_WIN record: Universe = top 50 + screened midcaps; rotate-to-best-performer rules; tactical overweights allowed; hard per-token cap at 8%.
## 2 — Log trades with explicit regime tags in a historical results journal
Tag every recorded trade and P&L event with its regime label and include metadata: token, entry/exit timestamps, position size (% NAV), trigger, stop, and any notes on liquidity or execution issues.
Fields to capture (minimum):
- Strategy record name (BROAD_RALLY / CONCENTRATED_WIN / MIXED)
- Token
- Entry price, exit price, realized P&L (%)
- Size as % of portfolio
- Trigger / rationale
- Stop level and reason
- Liquidity/volume observation
What to analyze from the journal
- Per-token hit-rate and average time-to-peak per regime
- Average drawdown and recovery time by regime
- Parameter drift: stop effectiveness, time-in-trade, or sizing sensitivity
Recording this metadata lets you filter results later and compare identical rules across different market structures.
## 3 — Run targeted comparison tests across token subsets and windows
Use your Strategy comparison tool (or spreadsheet) to filter historical results by token concentration metrics and by time windows that mimic concentrated conditions.
How to define concentrated windows (example approach)
- Compute a concentration metric for each window (e.g., share of index or strategy return captured by the top 5 tokens).
- Label windows where the top-5 share exceeds a threshold (example threshold: 40–60%; choose a value that fits your universe).
Comparison checklist
- Filter by concentration-labeled windows and compare the same strategy parameters.
- Focus on risk-adjusted metrics that matter for single-name risk: maximum drawdown, time-to-recovery, skew of returns, and realized tail events.
- Test sizing and stop variations: do tighter stops reduce drawdown without killing core winners? Does dynamic sizing reduce tail exposure?
Example test
Compare two sizing rules over concentrated windows:
- Rule A: equal-sized positions, cap 5% each
- Rule B: concentration-aware sizing (example below) with cap 8% but a dynamic penalty when market concentration rises
Inspect realized drawdown, number of wins vs losses, and the share of profits coming from top-1 or top-5 tokens.
## 4 — Concentration-aware token selection, sizing and monitoring templates
Below are concise templates you can adapt and paste into your workflow or results journal.
Token-selection filter (example rules)
- Exclude tokens with 30-day ADV < 0.5% of target NAV per position.
- Include tokens with 7-day realized volatility between 8% and 60% (tune for timeframe).
- Exclude tokens with active exchange delisting or clear custodial risk flags.
- Rank by 14-day momentum and apply a liquidity penalty to top ranks if market concentration > threshold.
Concentration-aware position-sizing (template)
Size_i = min(Size_max, RiskBudget * (1 / NumberOfActivePositions) * LiquidityFactor_i * (1 - ConcentrationIndex))
Where:
- Size_max = absolute cap per token (example 8%)
- RiskBudget = fraction of portfolio allocated to this strategy (example 30%)
- NumberOfActivePositions = target active positions (example 5)
- LiquidityFactor_i = min(1, ADV_i / ADV_threshold)
- ConcentrationIndex = a market-wide concentration measure scaled 0–0.5 (higher values tighten sizing)
Numeric example
- Portfolio NAV = $1,000,000; RiskBudget = 20% → $200,000 strategy notional
- Target positions = 5 → base slot = $40,000
- ADV_i / ADV_threshold = 0.5 → LiquidityFactor_i = 0.5
- ConcentrationIndex = 0.3 → (1 - 0.3) = 0.7
- Size_i = min(8%, 20% * (1/5) * 0.5 * 0.7) = min(8%, 0.2 * 0.2 * 0.35 = 0.014 = 1.4%) → ~$14,000
This shows how concentration and liquidity can materially reduce per-position sizes compared with a naive equal-size approach.
Monitoring checklist (concentration-aware)
- Daily: top-5 tokens’ share of the last 30 days’ strategy returns — flag if > chosen threshold.
- Intraday: single-token moves > 20–25% — review margin and liquidity risk.
- Weekly: compare realized liquidity vs ADV assumptions; update exit priorities.
- Monthly: rerun parameter sensitivity tests on journal entries within concentrated windows.
## 5 — Practical adjustments to common components
- Stops: prefer volatility-adjusted stops (ATR-based or volatility bands). Static percent stops tuned for broad rallies can be brittle in explosive single-name moves.
- Rebalancing: consider event-driven rebalancing (on breakout or volume surge) in concentrated regimes rather than only calendar rebalances.
- Exposure caps: set hard caps per token and a dynamic top-token cap that tightens when concentration metrics rise.
## 6 — Iterate: test, document and adapt
Maintain discipline: every rule change should have a hypothesis, a pre-mortem and a corresponding journal entry that links back to the strategy record. Use comparison tests to find parameters that are robust across regimes and those that need regime-specific treatment.
## Conclusion
A concentrated altseason is a regime problem: token-level idiosyncratic risk and rapid dominance of a few names change the trade-offs in selection, sizing and monitoring. Split strategy records by regime, tag outcomes, run concentration-focused comparisons and adopt sizing and monitoring rules that explicitly account for liquidity and concentration. Record every assumption and let documented outcomes, not intuition, guide iterative changes.
If you want to apply this workflow end-to-end, Trade Strategy supports Strategy management, a Historical results journal and Strategy comparison to document, tag and analyze your variants. Start conservatively, adapt thresholds to your universe and risk tolerance, and iterate based on recorded evidence.
Try this workflow with structured strategy records and tagged historical results. Learn more and access templates at https://trade-strategy.com/blog.
 2026-08-11
Exchange News Trading Checklist: A Practical 5‑Point Playbook
A fast, repeatable 5‑point checklist to assess liquidity, tag event trades, and stress-test strategy variants after exchange revenue misses or similar venue shocks.
 2026-08-11
How to Audit and Tag DeFi Strategies for Regulatory Exposure
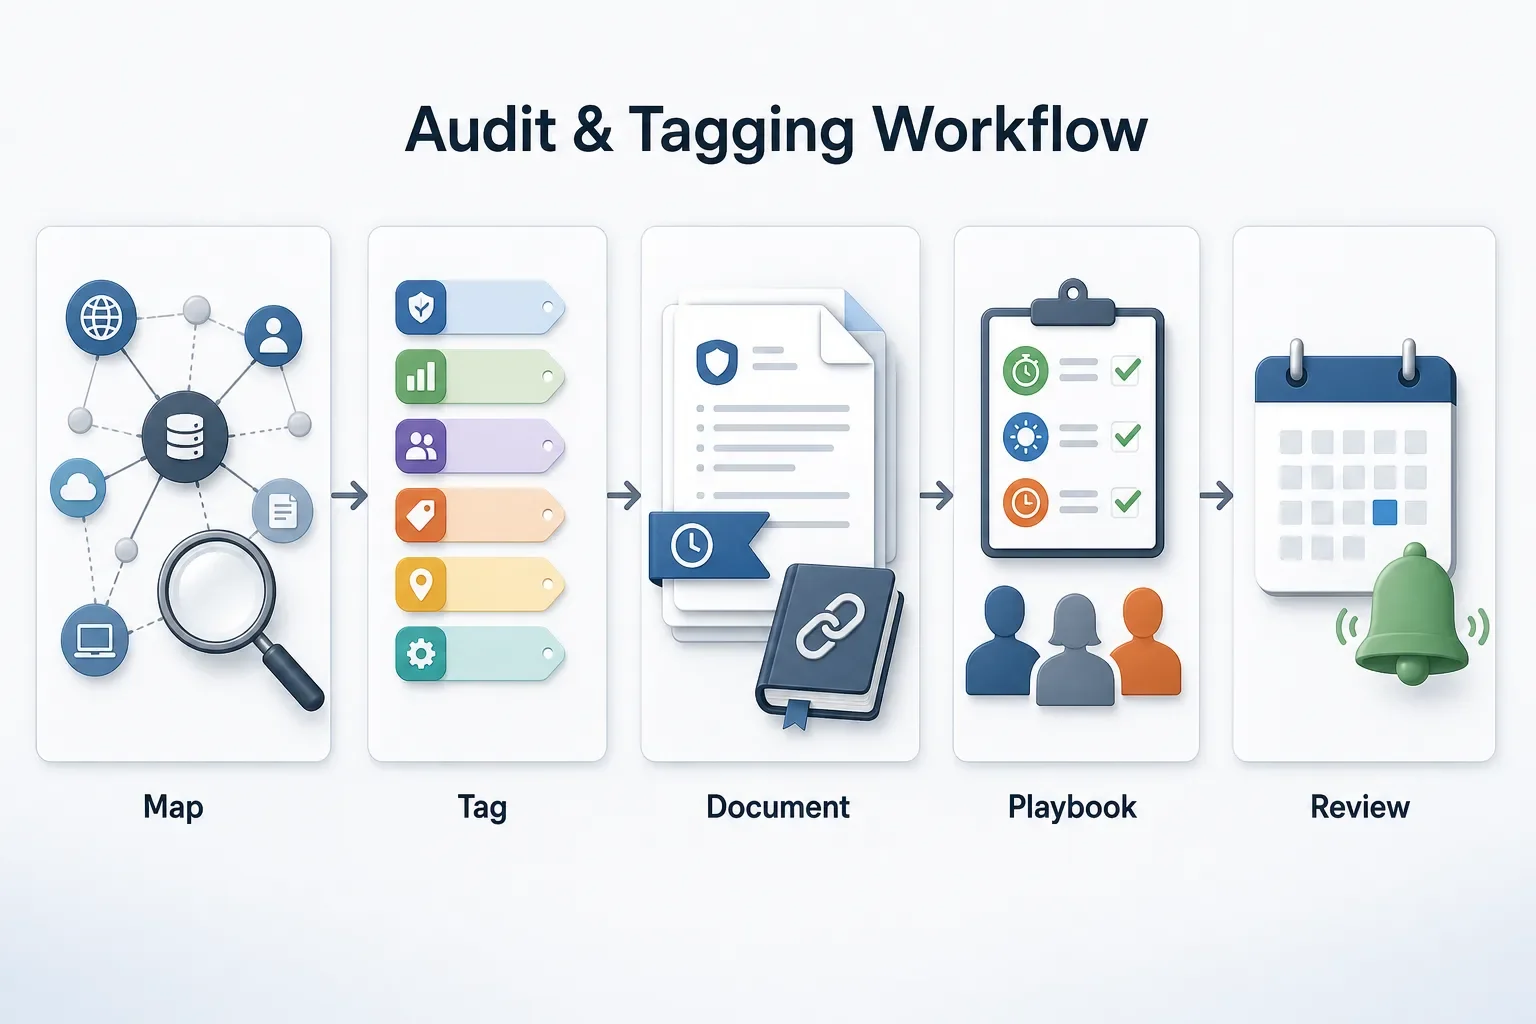
Practical, step‑by‑step workflow to map DeFi protocol touchpoints, tag regulatory exposure, preserve audit trails with documented rules and historical results, and prepare playbooks to respond quickly to enforcement events.
 2026-08-11
Miner Stress Testing for BTC Strategies: A Reproducible Case Study & Template
A forensic primer on turning a ~14% Bitcoin difficulty drop into testable strategy rules. Learn which miner metrics to track, how to encode stress variants (sizing, stops, filters) and how to record reproducible case studies in Trade Strategy.