
Miner Stress Testing for BTC Strategies: A Reproducible Case Study & Template
A forensic primer on turning a ~14% Bitcoin difficulty drop into testable strategy rules. Learn which miner metrics to track, how to encode stress variants (sizing, stops, filters) and how to record reproducible case studies in Trade Strategy.

# Trading BTC Through Miner Capitulation: A Reproducible Case Study & Strategy Template
Bitcoin mining difficulty recently fell ~14% from this year's high. For traders this is a protocol-level, lagging signal of weaker miner economics: lower difficulty typically follows falling miner revenue and reduced hashpower. Those conditions can increase the chance of miner selling, episodic volatility and short-lived regime shifts. This article walks through which miner-derived metrics matter, how to convert them into testable rule variations, and how to record and compare reproducible case studies using Trade Strategy’s released features.
## Introduction
Miner stress—signaled by difficulty drops, falling hash rate, declining miner revenue and on-chain outflows—can change the risk profile for BTC strategies. Rather than treating difficulty moves as a standalone buy/sell signal, encode miner-derived indicators into parameterized rule families so you can run controlled backtests and keep an auditable experiment trail.
This guide shows which miner metrics to track, practical rule families to test, a reproducible case-study workflow, and a ready-to-use template you can version-control and upload to Trade Strategy.
## Why a difficulty drop matters for traders
Difficulty is a lagging, protocol-level indicator of miner economics: the network reduces difficulty when overall hashpower contracts. Difficulty changes alone don't predict price moves, but they are a useful regime flag when combined with on-chain and market metrics.
When miner economics deteriorate, operators may increase on-chain sales, shut down rigs, or delay hardware reinvestment. From a trader’s perspective, a sustained difficulty contraction can:
- Increase episodic downside volatility during capitulation events.
- Change expected drawdowns for leveraged and trend-following approaches.
- Produce transient liquidity pressure if large miner holders move inventory to exchanges.
Track difficulty together with hash rate, miner revenue (USD/BTC), and miner coinbase or wallet outflows to build a clearer picture of miner stress than any single metric provides.
## Key miner-derived indicators and cadence
What to monitor and why:
- Difficulty (network-wide): a protocol-level, lagging flag for regime shifts when it moves materially.
- Hash rate: near-real-time estimate of mining power; falling hash rate supports an interpretation of miner shutdowns.
- Miner revenue (BTC/day and USD/day): block rewards/fees combined with price — a proxy for operator cash flow.
- Miner outflows / coinbase flows: on-chain signals that miners are moving BTC, potentially to exchanges.
Data cadence guidance:
- Use daily resolution for regime signals (difficulty windows, revenue trends).
- Use hourly or finer resolution to capture sharp outflow or volatility spikes associated with short-lived capitulation.
Suggested sources: blockchain metrics providers and exchange on-chain reports, combined with your market data for price, volume and realized volatility.
## Converting indicators into testable rule families
Below are practical rule families to encode miner stress into strategy variants. Parameterize each rule family so you can run controlled comparisons.
### 1) Position sizing under stress
- Baseline: fixed position size (e.g., 1% NAV per trade).
- Stress variant: scale down size when miner stress triggers.
Practical example:
- If 7-day difficulty change <= -8% AND 14-day miner revenue decline >= 20% → position size = baseline * 0.5
This creates a measurable entry for backtests and allows you to compare exposure-adjusted outcomes.
### 2) Stop and exit buffers
- Baseline stop: ATR-based stop at 2.5× ATR.
- Stress variant: widen stop to 3.5× ATR OR switch to a time-based exit to reduce sensitivity to miner-driven spikes.
Define the time-based exit explicitly (e.g., time_exit_7d) so backtests remain auditable.
### 3) Signal filters and delay
- Baseline entry: a moving-average cross or other primary signal.
- Stress variant: require extra confirmation (volume/volatility) or delay entry by N hours if miner outflows exceed a threshold.
Example: delay entry by 24 hours when 24-hour miner outflows exceed X BTC, to avoid initiating into an immediate capitulation move.
### 4) Cash or hedge tilt
- Baseline: fully allocated per rules.
- Stress variant: allocate a cash buffer (e.g., +10% cash) or add a short-duration hedge via futures when combined miner-stress score exceeds threshold.
### Scoring miner stress
Build a simple weighted stress score using z-scored 7-day difficulty change, 7-day hash-rate change and 14-day miner revenue change. Define numeric thresholds (for example: score >= 1.5 = severe) and document them explicitly in your strategy record so variants are reproducible.
## Reproducible case study: step-by-step setup
Follow these steps to create an auditable case study you can reproduce and compare:
1) Define a baseline strategy compactly (entry, exit, sizing, stop) and record it in a single document.
2) Define 3 miner-stress variations (mild, moderate, severe) with explicit numeric parameters.
3) Pull historical chain and market data for the chosen test window and note sources and any preprocessing steps.
4) Run backtests in your analysis environment (Python/R/other). Save trade logs, parameter files and summary outputs.
5) Record the baseline and each variant in Trade Strategy’s Strategy management and upload the historical performance summaries and trade logs to the Historical results journal.
6) Use Strategy comparison to view saved variants side-by-side and preserve the audit trail.
Example qualitative variant matrix you can paste into documentation:
| Variant | Trigger (example) | Position sizing | Stop rule | Expected effect |
|---|---:|---|---|---|
| Baseline | none | 1% NAV | 2.5× ATR | Neutral-regime behaviour |
| Mild stress | 7d diff <= -5% | 0.75% NAV | 3.0× ATR | Reduced exposure, modest buffer |
| Moderate stress | 7d diff <= -8% & rev -14d <= -15% | 0.5% NAV | 3.5× ATR or time exit | Lower exposure, wider buffers |
| Severe stress | 7d diff <= -12% & miner outflows spike | 0.25% NAV + 10% cash | Time-based exit | Minimize drawdown during capitulation |
Include the variant matrix verbatim in your strategy record so comparisons remain auditable.
## Practical template snippet (YAML)
```yaml
---
name: "BTC - MA trend with miner stress sizing"
timeframe: "1D"
entry:
signal: "ma_short_cross_ma_long"
confirm: "volume > SMA(volume,14)"
position_sizing:
baseline_pct: 0.01
stress_adjust:
mild: 0.75
moderate: 0.5
severe: 0.25
stop:
baseline: "2.5*ATR(14)"
stress_variant: "3.5*ATR(14) or time_exit_7d"
miner_signals:
difficulty_window_days: 7
revenue_window_days: 14
thresholds:
mild: -5
moderate: -8
severe: -12
---
```
Save this YAML as a version-controlled strategy definition and record each backtest run alongside it.
## Recording and comparing results in Trade Strategy
- Create a new strategy record and paste your rules and assumptions into Strategy management.
- After running backtests externally, upload or paste historical performance summaries and trade logs into the Historical results journal.
- Save each variant as a separate strategy record or tag versions, then use Strategy comparison to view outcomes side-by-side and preserve an auditable experiment trail.
Note: Trade Strategy is a decision-support and strategy-evaluation platform; it does not execute trades. The Elite plan unlocks AI-powered recommendations that analyze strategy performance and suggest improvements as decision support.
## Conclusion
Miner stress (as signaled by difficulty drops, falling hash rate, declining miner revenues and wallet outflows) is a measurable regime signal you can convert into parameterized, testable rule variations. The practical rule families and the reproducible template above provide a starting point for controlled experiments. Record your baseline and variants, save trade logs and comparison outputs, and use Trade Strategy’s Strategy management, Historical results journal and Strategy comparison to keep an auditable trail of your experiments.
Download the strategy template and step-by-step guide on our blog, and try Trade Strategy to record and compare your miner-stress tests: https://trade-strategy.com/blog
 2026-08-11
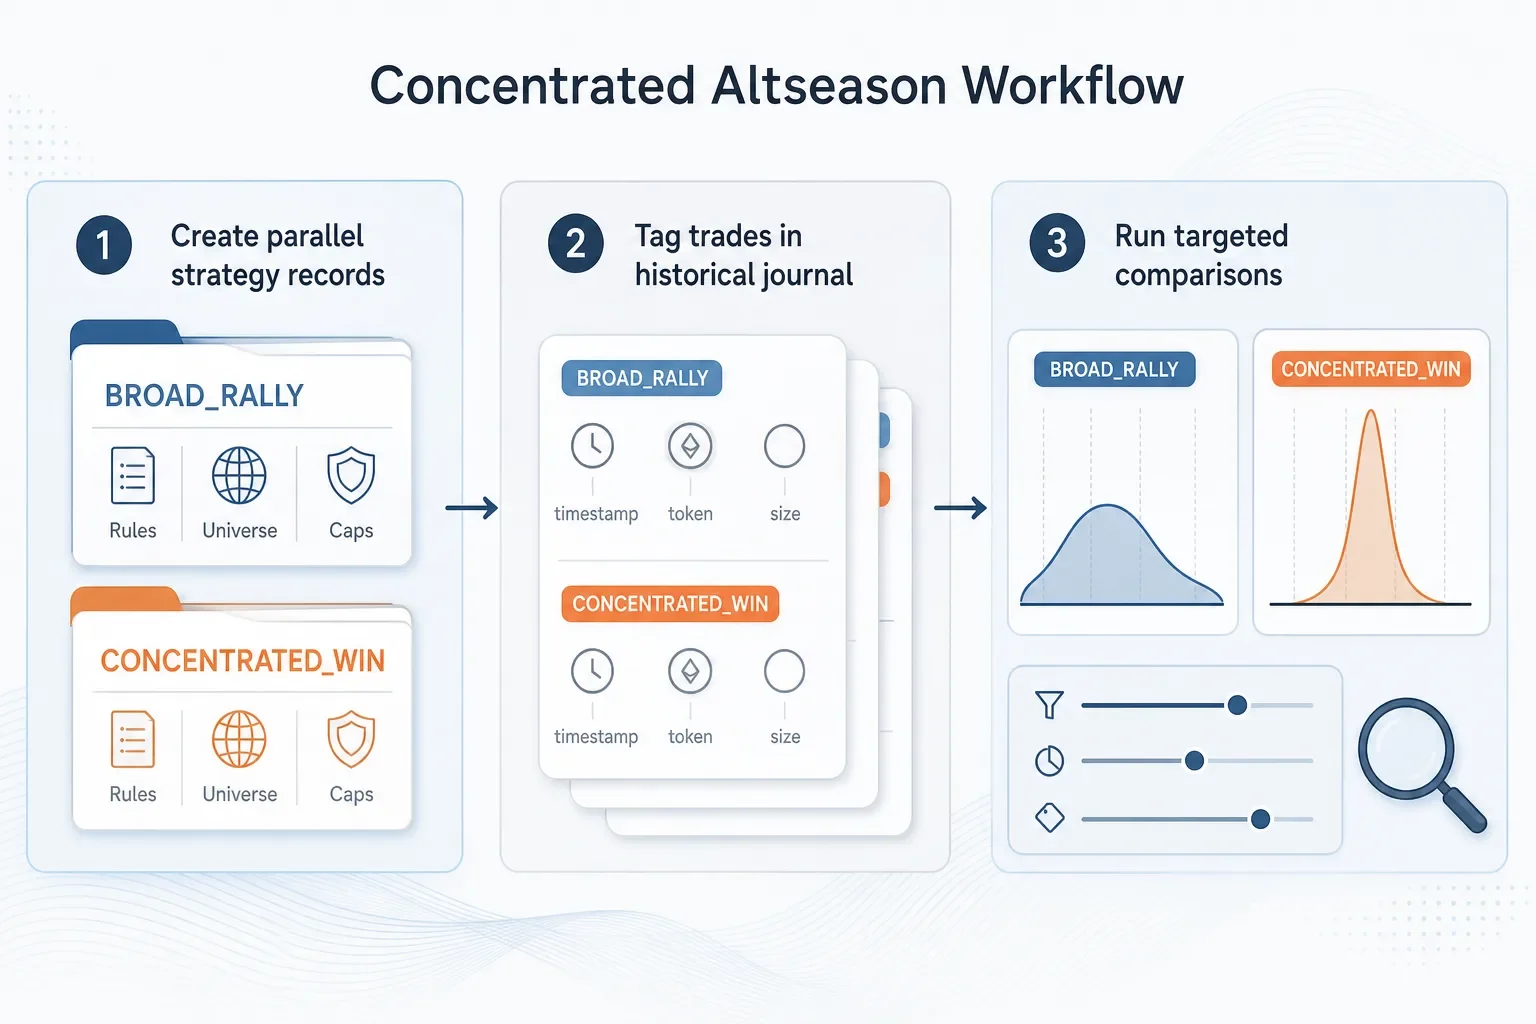
How to Adapt Your Strategies for a More Concentrated Altseason
Step-by-step workflow to adapt trading strategies for a concentrated altseason: create regime-specific strategy records, tag outcomes in a historical journal, compare results across token subsets, and apply concentration-aware sizing and monitoring.
 2026-08-11
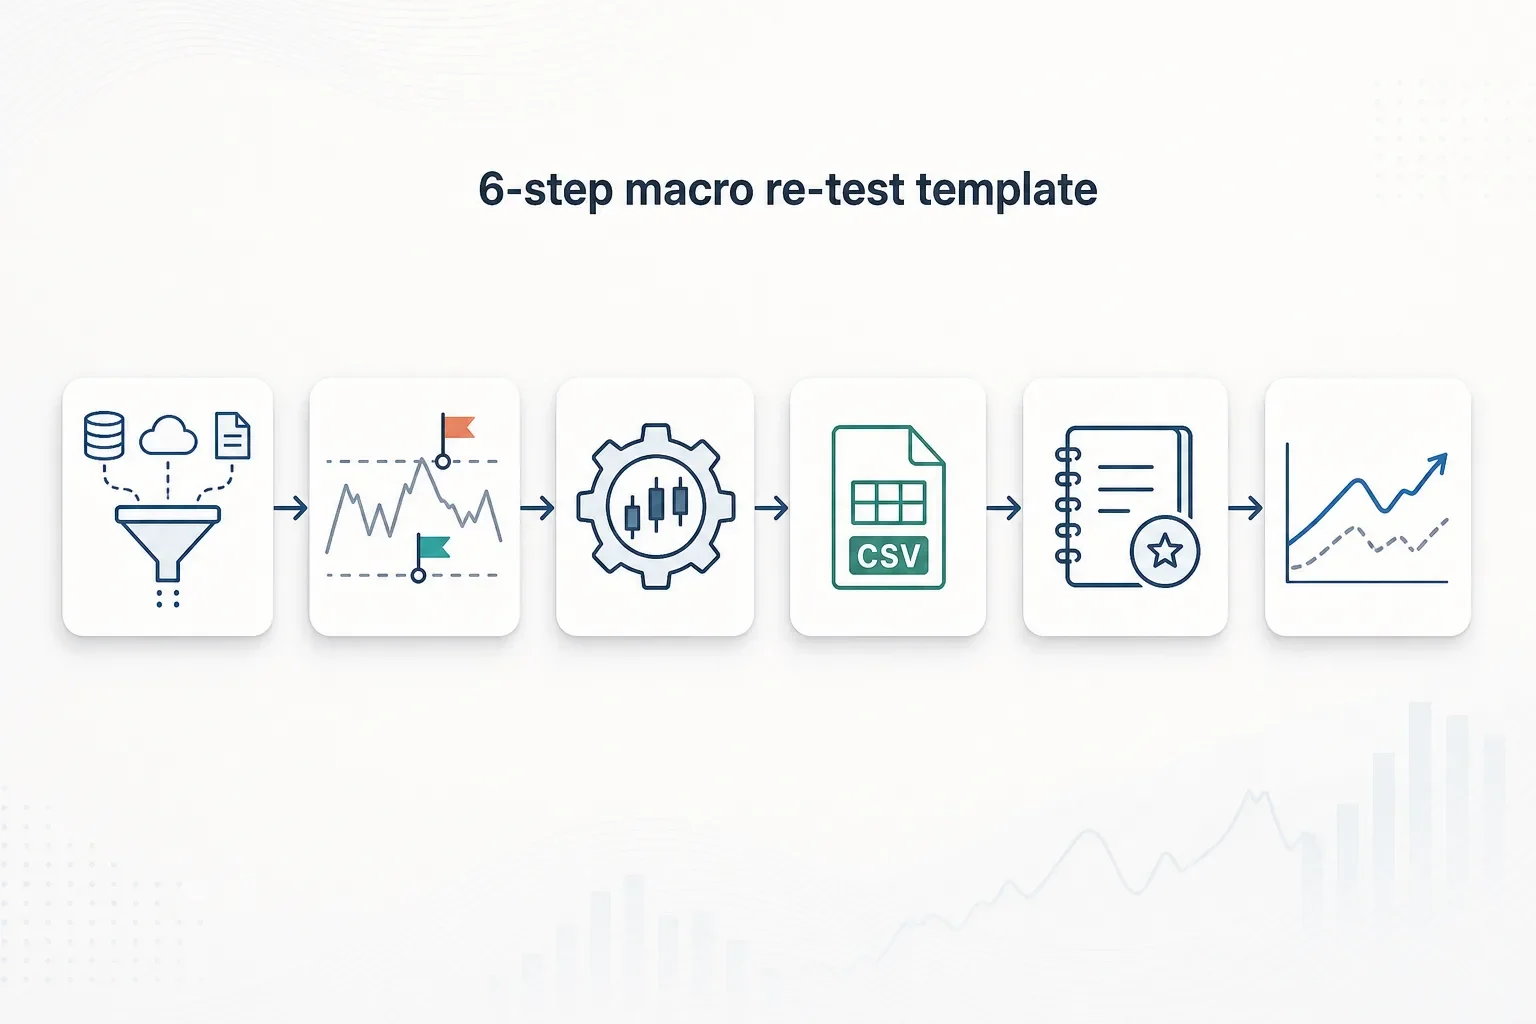
How to Backtest Crypto Strategies Against Rising Rates and Oil Shocks — A Practical Template
A hands-on template for re-testing crypto strategies when rates and oil spike: ingest macro time series, run variant backtests, record results in Trade Strategy, and compare outcomes to adapt sizing rules.
 2026-08-11
Exchange News Trading Checklist: A Practical 5‑Point Playbook
A fast, repeatable 5‑point checklist to assess liquidity, tag event trades, and stress-test strategy variants after exchange revenue misses or similar venue shocks.