
RSI Divergence BTC Example: How to Find Bitcoin Reversal Signals
Learn how to identify RSI divergence on Bitcoin charts, how traders use this signal to detect potential market reversals, and how to backtest an RSI divergence strategy using historical BTC data. This beginner-friendly guide explains real chart examples, strategy rules, performance analysis, advantages, limitations, and how to test the strategy using Trade-Strategy.com
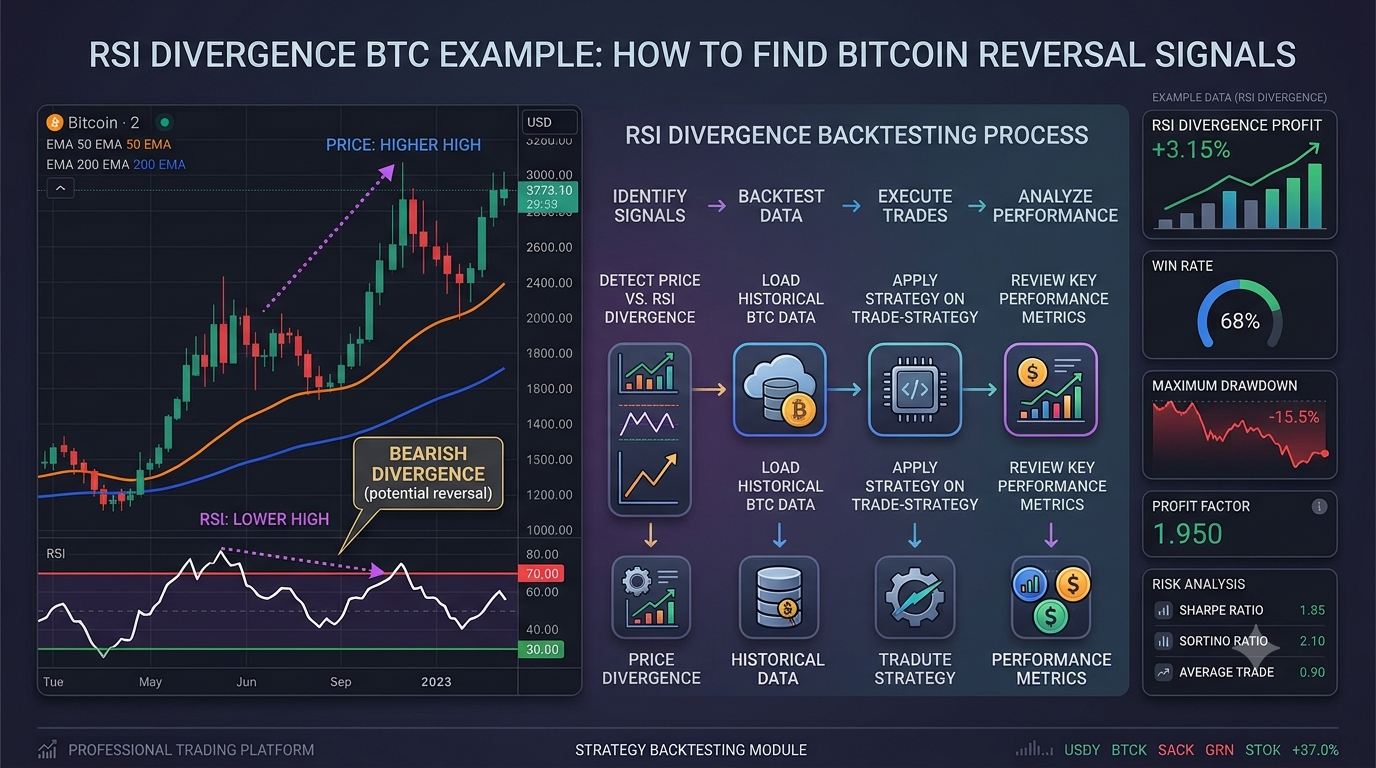
RSI divergence is one of the most popular technical analysis concepts used by cryptocurrency traders to identify potential market reversals. Bitcoin often moves through strong trends, but momentum does not always follow price. When price reaches a new high or low while the RSI indicator shows a different behavior, traders receive a warning that the current trend may be losing strength.
This article explains how RSI divergence works, how to identify bullish and bearish divergence on Bitcoin charts, how traders can backtest this strategy, and how to evaluate whether it provides a real trading advantage. The examples are designed for beginner traders who want to move from simple indicator usage toward data-driven trading decisions.
What Is RSI Divergence?
The Relative Strength Index (RSI) is a momentum indicator developed by J. Welles Wilder. It measures the speed and strength of price movements on a scale from 0 to 100.
Most traders use RSI with traditional levels:
- RSI above 70: potentially overbought conditions
- RSI below 30: potentially oversold conditions
However, experienced traders often focus more on divergence rather than fixed RSI levels.
A divergence occurs when Bitcoin price and RSI move in opposite directions.
Bullish RSI Divergence Example on Bitcoin
A bullish divergence happens when:
- Bitcoin price creates a lower low
- RSI creates a higher low
- Momentum weakness suggests sellers are losing control
Example:
Imagine Bitcoin falls from $70,000 to $60,000. A few weeks later, BTC drops again to $58,000. Price created a new lower low. However, RSI does not confirm this move and creates a higher low, moving from RSI 25 to RSI 35.
This situation indicates that selling pressure may be decreasing. Some traders interpret this as a possible reversal opportunity.
Bearish RSI Divergence Example
A bearish divergence is the opposite situation:
- Bitcoin price creates a higher high
- RSI creates a lower high
- Momentum is weakening despite rising prices
Example:
Bitcoin rises from $55,000 to $70,000. Later it reaches $72,000, but RSI creates a lower peak compared to the previous rally. This may suggest that buyers are becoming weaker.
RSI Divergence Chart Illustration
The illustration above shows a simplified bullish divergence. Bitcoin price creates a lower low, while RSI creates a higher low. This difference between price and momentum creates the divergence signal.
How to Build an RSI Divergence Strategy
A backtest requires clear rules. A trader cannot test a strategy based only on visual interpretation because every decision must be measurable.
Example rules:
| Parameter | Rule |
|---|---|
| Market | BTC/USDT |
| Timeframe | Daily candles |
| Indicator | RSI 14 periods |
| Entry | Bullish RSI divergence detected |
| Exit | RSI reaches overbought zone or fixed target |
| Risk Management | Defined stop loss per trade |
How to Backtest RSI Divergence on Trade-Strategy
Before using any RSI divergence strategy with real money, traders should test how it performed historically. Backtesting allows you to analyze hundreds of historical market situations without risking capital.
You can perform Bitcoin strategy backtests using Trade-Strategy.com/app. Backtesting is also available with a free account, allowing beginners to experiment with different strategy ideas before moving to live trading.
A typical RSI divergence backtest process looks like this:
- Select BTC/USDT as the market.
- Choose historical data range.
- Select daily timeframe.
- Add RSI indicator with period 14.
- Define divergence entry conditions.
- Set exit rules.
- Add trading fees and realistic execution settings.
- Run the simulation and analyze results.
Example RSI Divergence Backtest Results
A proper backtest should always focus on more than just the final profit number. Many beginner traders make the mistake of looking only at returns and ignoring risk, drawdowns, and the number of trades. A strategy that produces a high return but experiences extreme losses may not be suitable for most traders.
The table below shows an example structure of how RSI divergence backtest results can be analyzed. The numbers are for educational demonstration purposes and show which metrics traders should review when evaluating a strategy.
| Metric | Example Result | Why It Matters |
|---|---|---|
| Initial Capital | $10,000 | Starting amount used for simulation |
| Total Trades | 42 | Shows how frequently the strategy generates signals |
| Winning Trades | 24 | Measures successful positions |
| Losing Trades | 18 | Shows losing trade frequency |
| Win Rate | 57% | Percentage of profitable trades |
| Average Trade | Positive | Shows average expected outcome per trade |
| Maximum Drawdown | Important Risk Metric | Shows the largest historical account decline |
| Profit Factor | Above 1.0 | Compares gross profits versus losses |
Advantages of RSI Divergence Strategy
RSI divergence has several characteristics that make it attractive for beginner and experienced traders.
- Early reversal detection: RSI divergence can identify weakening momentum before a trend completely changes direction.
- Works across multiple markets: The concept can be applied to Bitcoin, cryptocurrencies, stocks, forex, and other liquid assets.
- Simple concept: The basic idea of comparing price movement with momentum is easy to understand.
- Useful confirmation tool: RSI divergence can be combined with support levels, moving averages, volume analysis, or market structure.
- Flexible timeframe usage: Traders can test the strategy on short-term charts as well as higher timeframes.
Limitations of RSI Divergence
Although RSI divergence is popular, it is not a guaranteed reversal signal. Like every technical analysis method, it has limitations.
- False signals: Bitcoin can continue moving in the same direction even after divergence appears.
- Timing problems: A divergence can appear long before an actual reversal happens.
- Strong trends: During powerful bull or bear markets, divergence signals may fail repeatedly.
- Subjective interpretation: Different traders may identify different divergence points.
- Low signal frequency: On higher timeframes, quality signals may appear only a few times per year.
Common Mistakes When Trading RSI Divergence
Many beginners lose money because they use divergence as an automatic buy or sell signal. Professional traders usually combine multiple factors before entering a position.
- Entering immediately after seeing divergence without confirmation.
- Ignoring the overall Bitcoin trend.
- Using extremely low timeframes with too much market noise.
- Not including trading fees in calculations.
- Changing strategy rules after seeing historical results.
- Testing only one market period.
How to Improve an RSI Divergence Strategy
A basic RSI divergence strategy can often be improved by adding additional filters.
| Improvement | Purpose |
|---|---|
| Trend Filter | Trade only in the direction of the bigger market trend |
| Moving Average Confirmation | Use indicators like 200 EMA to identify market direction |
| Volume Confirmation | Verify that the reversal has real market participation |
| Stop Loss Rules | Protect capital during failed signals |
| Position Sizing | Control risk on every trade |
Example Trading Workflow
The workflow above represents a professional approach:
- Identify a possible RSI divergence on the Bitcoin chart.
- Define exact entry and exit rules.
- Backtest the strategy using historical data.
- Analyze profitability and risk metrics.
- Improve the strategy before considering live trading.
Backtesting vs Live Trading
A successful backtest does not automatically mean a strategy will make money in the future. Markets constantly change because of liquidity, regulations, participants, and macroeconomic conditions.
The purpose of backtesting is not to find a perfect strategy. The goal is to understand how a strategy behaves in different market conditions and whether it has enough potential to justify further testing.
After completing a backtest, many professional traders use paper trading or small position sizes before increasing exposure.
Final Thoughts
RSI divergence is a powerful concept because it helps traders understand the relationship between price and momentum. When Bitcoin moves lower but RSI shows improving strength, it can provide an early warning that sellers may be losing control.
However, RSI divergence should never be treated as a guaranteed prediction tool. The best results usually come from combining divergence with proper risk management, trend analysis, and disciplined backtesting.
For beginners, the most important lesson is simple: do not trade an idea just because it looks good on a chart. Test it, measure it, understand its weaknesses, and improve it over time.
Using platforms such as Trade-Strategy allows traders to transform a trading idea into measurable data. A structured backtesting process can help beginners develop better habits and make more informed decisions in the cryptocurrency market.
 2026-08-07
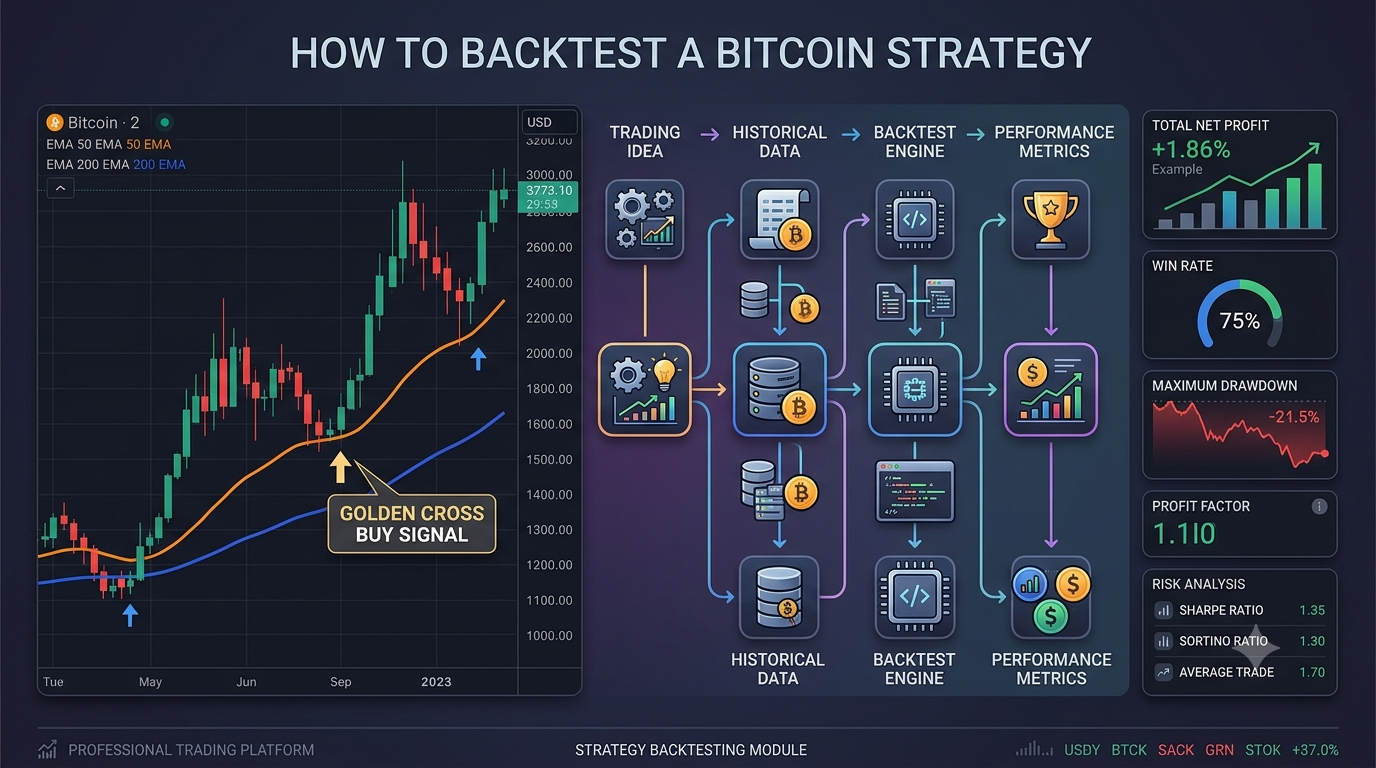
How to Backtest a Bitcoin Strategy
Learn how to backtest a Bitcoin trading strategy using a simple 50 EMA / 200 EMA crossover example. Discover which metrics matter most, common mistakes to avoid, and best practices for evaluating trading performance before risking real capital.
2026-08-07BTC Paper Trading Strategy: How to Test Bitcoin Trading Without Risking Real Money
Discover how BTC paper trading works and why every beginner trader should use simulation before risking real money. Learn how to build a Bitcoin paper trading strategy, analyze historical data, evaluate backtest results, and test your ideas using Trade-Strategy.
 2026-08-07
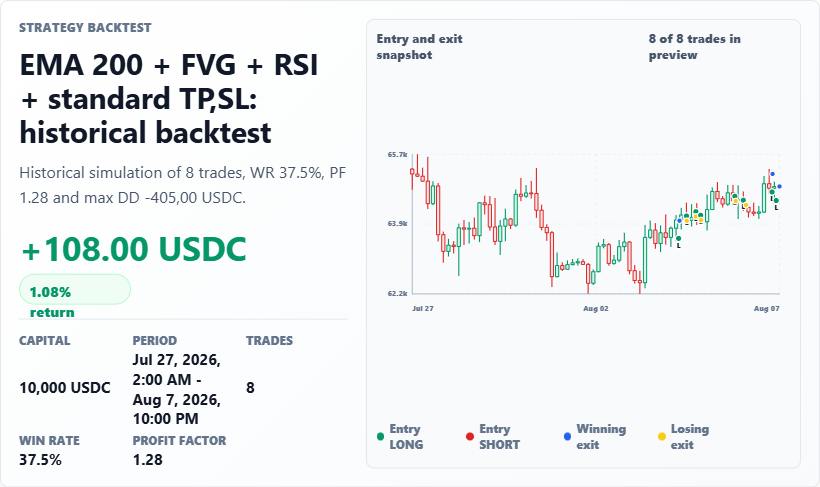
BTC/USDC Backtest: EMA 200, FVG and RSI Results
This BTC/USDC backtest covers eight 1-hour trades from July 27 to August 7, 2026. The EMA 200, FVG and RSI strategy returned 108 USDC, with a 37.5% win rate.