
BTC/USDC Backtest: EMA 200, FVG and RSI Results
This BTC/USDC backtest covers eight 1-hour trades from July 27 to August 7, 2026. The EMA 200, FVG and RSI strategy returned 108 USDC, with a 37.5% win rate.
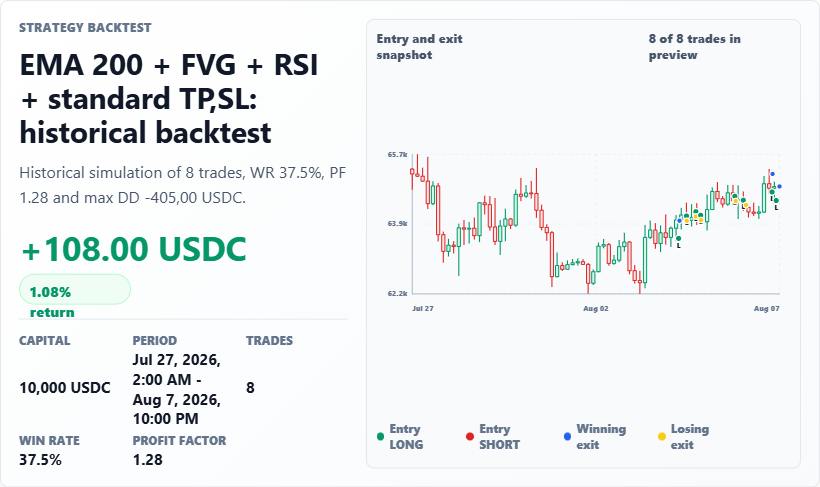
This historical BTC/USDC simulation tested the EMA 200 + FVG + RSI + standard TP,SL strategy on a 1-hour interval. Across eight trades, the test produced a total profit of 108 USDC and a 1.08% return on 10,000 USDC of starting capital.
Backtest overview
- Test period: July 27, 2026, at 2:00 AM to August 7, 2026, at 10:00 PM
- Market: BTC/USDC
- Interval: 1 hour
- Starting capital: 10,000 USDC
- Leverage: 3x
- Total trades: 8
- Position direction: Long and short
Key results
| Metric | Result |
|---|---|
| Total PnL | 108 USDC |
| Return | 1.08% |
| Win rate | 37.5% |
| Profit factor | 1.28 |
| Maximum drawdown | -405 USDC |
| Average R | 0.25 |
The result was positive despite a win rate below 50%. The profit factor of 1.28 indicates that gross gains exceeded gross losses in this sample. The maximum drawdown was 405 USDC, measured as a negative value in the backtest report.
How the strategy was configured
The setup used a 200-period exponential moving average as part of its trend framework, with fair value gap conditions and a 14-period RSI filter. The RSI range was configured between 35 and 65, while the strategy accepted both long and short positions in per-side mode.
Entry and exit parameters
- Target multiple: 2
- Take-profit setting: 2.1%
- Stop-loss setting: 0.56%
- Stop ATR multiple: 1
- Stop buffer: 15%
- Maximum holding period: 32 bars
The configured decision threshold was 55, with a minimum quality value of 0.65. The volume Z-score threshold was 1, and the taker-flow threshold was 0.12.
Cost and execution assumptions
The simulation included a 0.04% buy transaction cost and a 0.04% sell transaction cost. The configured round-trip cost was 0.08%, and the daily funding cost was 0.03%. These assumptions are important when comparing the reported result with other tests.
How to interpret the sample
Eight trades provide a limited observation set. The combination of a 37.5% win rate, 1.28 profit factor and 0.25 average R shows that the backtest outcome depended on the size of winning trades relative to losing trades, rather than on a majority of trades being profitable.
The 1.08% return should also be viewed alongside the -405 USDC maximum drawdown. Leverage was set to 3x, so the reported drawdown and return reflect the configuration used in this simulation rather than an unleveraged result.
Risk note
This is a historical backtest, not a forecast or investment advice. The test contains eight trades and may not represent future BTC/USDC market conditions. Slippage, liquidity, funding changes and live execution can produce different results.
 2026-08-07
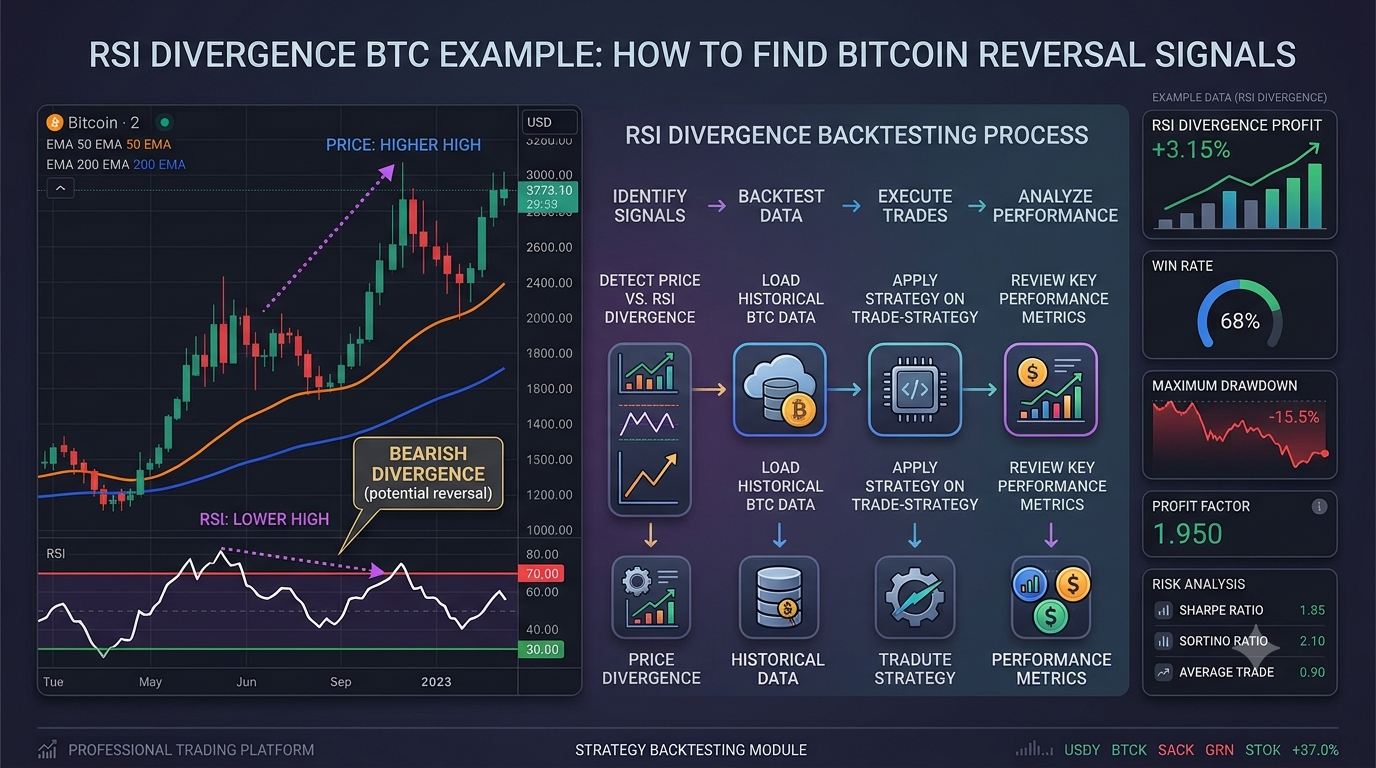
RSI Divergence BTC Example: How to Find Bitcoin Reversal Signals
Learn how to identify RSI divergence on Bitcoin charts, how traders use this signal to detect potential market reversals, and how to backtest an RSI divergence strategy using historical BTC data. This beginner-friendly guide explains real chart examples, strategy rules, performance analysis, advantages, limitations, and how to test the strategy using Trade-Strategy.com
 2026-08-11
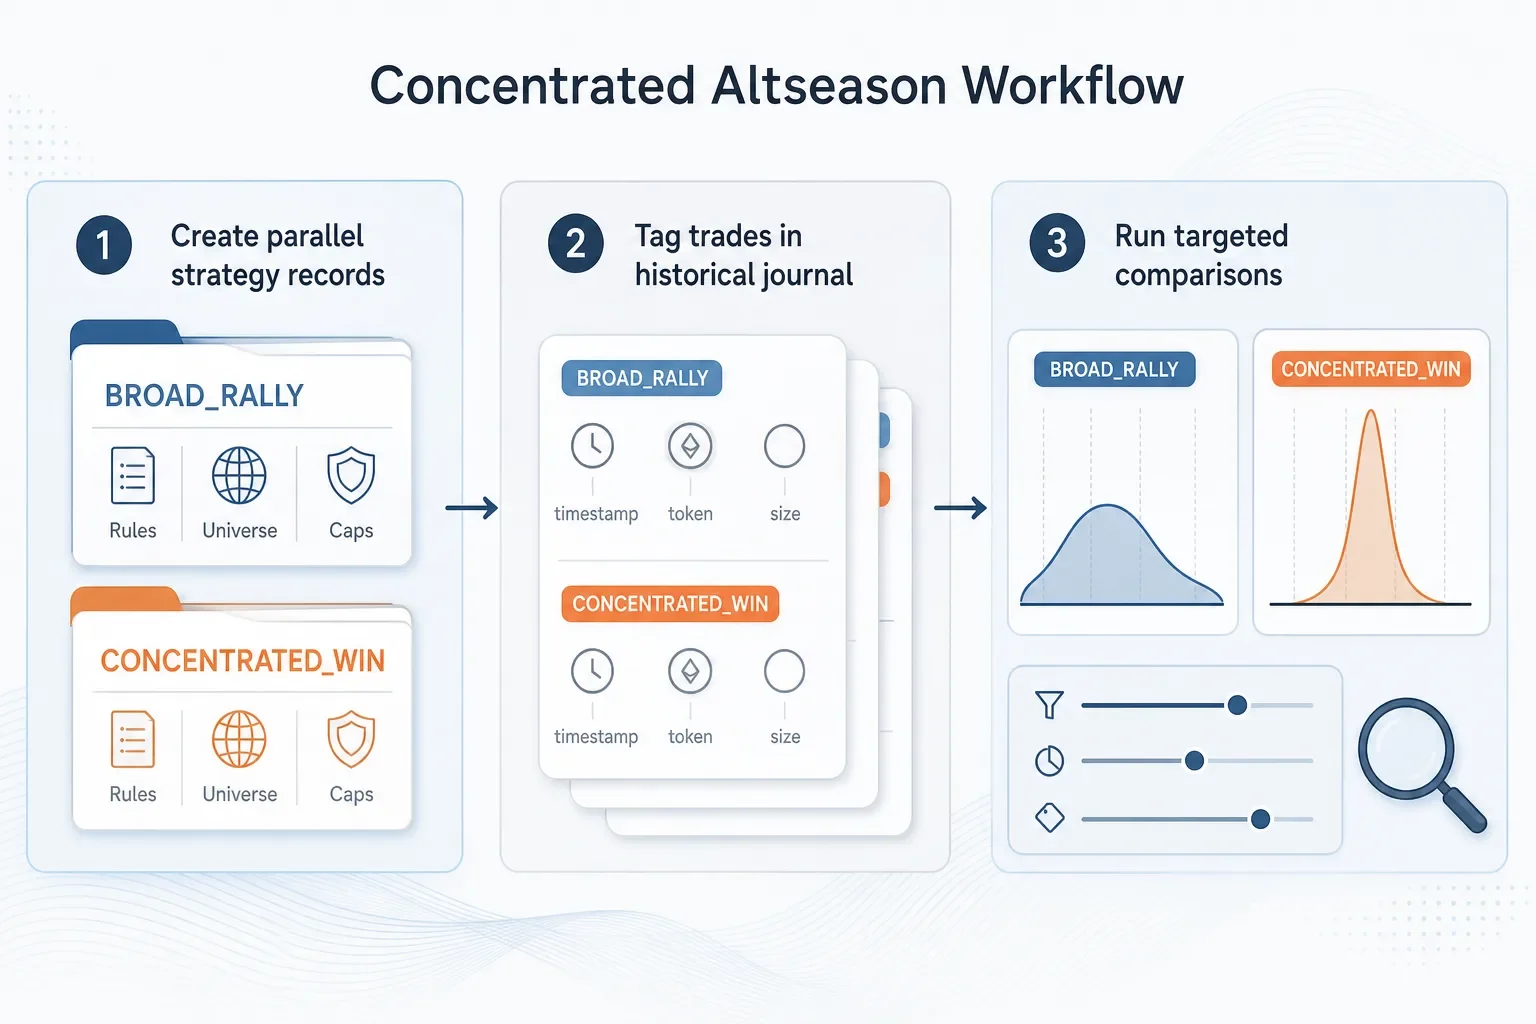
How to Adapt Your Strategies for a More Concentrated Altseason
Step-by-step workflow to adapt trading strategies for a concentrated altseason: create regime-specific strategy records, tag outcomes in a historical journal, compare results across token subsets, and apply concentration-aware sizing and monitoring.
 2026-08-11
Miner Stress Testing for BTC Strategies: A Reproducible Case Study & Template
A forensic primer on turning a ~14% Bitcoin difficulty drop into testable strategy rules. Learn which miner metrics to track, how to encode stress variants (sizing, stops, filters) and how to record reproducible case studies in Trade Strategy.