
When AI Flows Cool and Crypto Breaks Out: A Practical Playbook for Regime-Shift Trading
A practical playbook for detecting and responding to regime shifts when AI-driven flows cool and crypto potentially breaks out. Steps to detect, tag, re-test and compare strategies using Trade Strategy's released features.

# When AI Flows Cool and Crypto Breaks Out: A Practical Playbook for Regime-Shift Trading
## Introduction
Cointelegraph recently highlighted an analyst view that AI-driven flows into markets may be cooling — a rotation that can free capital for crypto and create a different set of dominant market drivers. For traders this kind of rotation can produce a regime shift: price dynamics, correlations and volatility profiles change, and strategies tuned to the previous regime can decay.
This article explains why regime shifts cause model drift and gives a hands-on workflow you can use to detect, document and re-test strategies quickly. The workflow is tool-agnostic for core steps and shows where Trade Strategy’s released features (strategy management, historical results journal and strategy comparison) can help manage the process. We also note planned roadmap items — AI-assisted BTC market analysis and probabilistic direction suggestions — as upcoming decision-support tools.
## Why a regime shift matters for trading strategies
### Drivers of model decay
A regime shift alters the underlying statistical environment that your strategy assumes. Common consequences:
- Change in volatility and intraday ranges that affect stop placement and position sizing.
- Shifted correlations (e.g., BTC responding more to macro or retail flows rather than AI-driven equity arbitrage).
- Different liquidity and slippage characteristics around breakouts or quiet periods.
- Altered signal performance: indicators that worked in one regime may lag in another.
### The practical cost
Model decay shows up as a gradual degradation in key KPIs: lower hit rates, poorer risk‑adjusted returns, or unexpected drawdowns. If you don’t detect regime changes early, you may misattribute the problem to randomness instead of structural change.
## A step-by-step regime-shift playbook
This is an operational workflow you can apply the moment you suspect a regime change (for example, after news that AI-driven flows are cooling). The playbook is intentionally practical and highlights where Trade Strategy features support documentation and comparison.
### Step 0 — Prepare tags and baselines
- Define regime labels you will use (e.g., Pre‑AI‑peak, Rotation, Crypto‑Breakout). Keep labels short and consistent.
- Capture baseline KPIs for each strategy: win rate, expectancy, average return per trade, max drawdown and exposure. Store these baselines in your results journal so you can compare later.
How Trade Strategy helps: create strategies in Strategy management and record baseline notes and assumptions. Use the Historical results journal to store KPI snapshots as reference points.
### Step 1 — Detect signals of regime change
- Monitor macro headlines and flow commentary: rotation from AI‑driven equity allocations, ETF flows, large re‑allocations from HFT desks.
- Watch price structure in BTC and related crypto: pattern changes, break of multi‑week ranges, or a step‑change in realized volatility.
- Set quantitative thresholds you care about (e.g., 20% change in rolling vol or a correlation shift between BTC and risk assets).
Practical example: if realized volatility for BTC doubles relative to the prior 30‑day window and an equity‑BTC correlation drops materially, flag a potential regime event.
### Step 2 — Tag trades and periods
- Immediately tag new trades and historical trades that fall into the suspected regime window with your chosen label.
- For historical analysis, mark a boundary date (or dates) that separate regimes (e.g., the date when flow commentary indicated a peak).
How Trade Strategy helps: include regime assumptions in the strategy definition and add regime labels to entries in the Historical results journal so you can filter later.
### Step 3 — Quick re‑test and sensitivity checks
- Re‑run your backtests or forward‑simulations with regime‑specific windows: compare pre‑regime, transition, and post‑regime periods.
- Run sensitivity checks on key parameters: stop distances, lookback lengths and trend thresholds. Prefer parameter sweeps to single‑point tests.
Practical example: compare a momentum strategy’s return per trade and max drawdown in the six months before the rotation vs the six months after. Don’t assume identical parameter settings will hold.
### Step 4 — Compare strategies side‑by‑side
- Assemble the same KPIs for each strategy across the regime‑labelled windows.
- Prioritize strategies that maintain risk characteristics and robustness across regimes or those that profit from the new dynamics (e.g., breakout‑focused approaches if volatility and trend initiation rise).
How Trade Strategy helps: use Strategy comparison to view saved strategy information and recorded historical results side‑by‑side across regime labels. This supports evidence‑based reweighting decisions without relying on memory or spreadsheets.
### Step 5 — Adjust sizing, rules and risk controls
- Reduce position sizes for strategies that show degradation and increase sizing for strategies that remain robust or are designed for the new regime.
- Consider rule changes (shorter lookbacks in higher‑vol regimes, wider stops, or volatility‑normalized sizing).
- Document every change and the hypothesis behind it so future attribution is possible.
How Trade Strategy helps: keep a clear audit trail in Strategy management and the Historical results journal. Documenting assumptions prevents “strategy creep.”
## Two short case examples (illustrative)
### Example A — Momentum strategy
- Observation: momentum entry signals weaken in the new rotation; hit rate falls.
- Response: tag post‑rotation trades, re‑run tests on post‑rotation data, shorten lookback and tighten exit criteria. If post‑rotation KPIs remain weak, reduce allocation.
### Example B — Breakout strategy
- Observation: volatility and range expansions lead to more reliable breakouts.
- Response: tag the transition window, compare pre‑ and post‑regime results, and consider increasing allocation to breakout rules that show robust post‑rotation performance.
Note: these are illustrative workflow steps. Do not assume specific performance; run your own tests and document results.
## Using tooling responsibly — what Trade Strategy provides and what’s upcoming
Released features you can use today:
- Strategy management: create, organize and document strategy rules and assumptions so they’re easy to revisit when regimes shift.
- Historical results journal: record and monitor historical strategy results and attach regime labels for analysis.
- Strategy comparison: compare strategies using saved information and recorded historical results to support evidence‑based reallocation.
Planned roadmap items (upcoming decision support):
- Trade Strategy plans AI‑assisted BTC market analysis using multi‑timeframe market structure and indicators.
- The roadmap includes probabilistic direction suggestions intended as decision support (described as probabilistic, not certain).
## Checklist — first 60 minutes after you suspect a regime shift
1. Capture the trigger and set a regime label.
2. Tag active trades and the historical results covering the suspected window.
3. Snapshot current KPIs in your results journal.
4. Re‑run critical backtests or forward‑tests for the labeled windows.
5. Use strategy comparison to identify robust rules.
6. Adjust sizing and document hypothesis for each change.
## Conclusion
Regime shifts — whether triggered by cooling AI flows or renewed crypto flows — are part of markets. The practical advantage goes to traders who detect changes quickly, document assumptions and compare strategy performance across labeled regimes. Use a consistent workflow: detect, tag, re‑test, compare and document decisions.
If you want a printable regime‑shift checklist and a step‑by‑step how‑to, read the full how‑to and download the checklist on our blog: https://trade-strategy.com/blog
Remember: document your hypothesis, test with data, and treat AI outputs as probabilistic decision support rather than certainty.
 2026-08-11
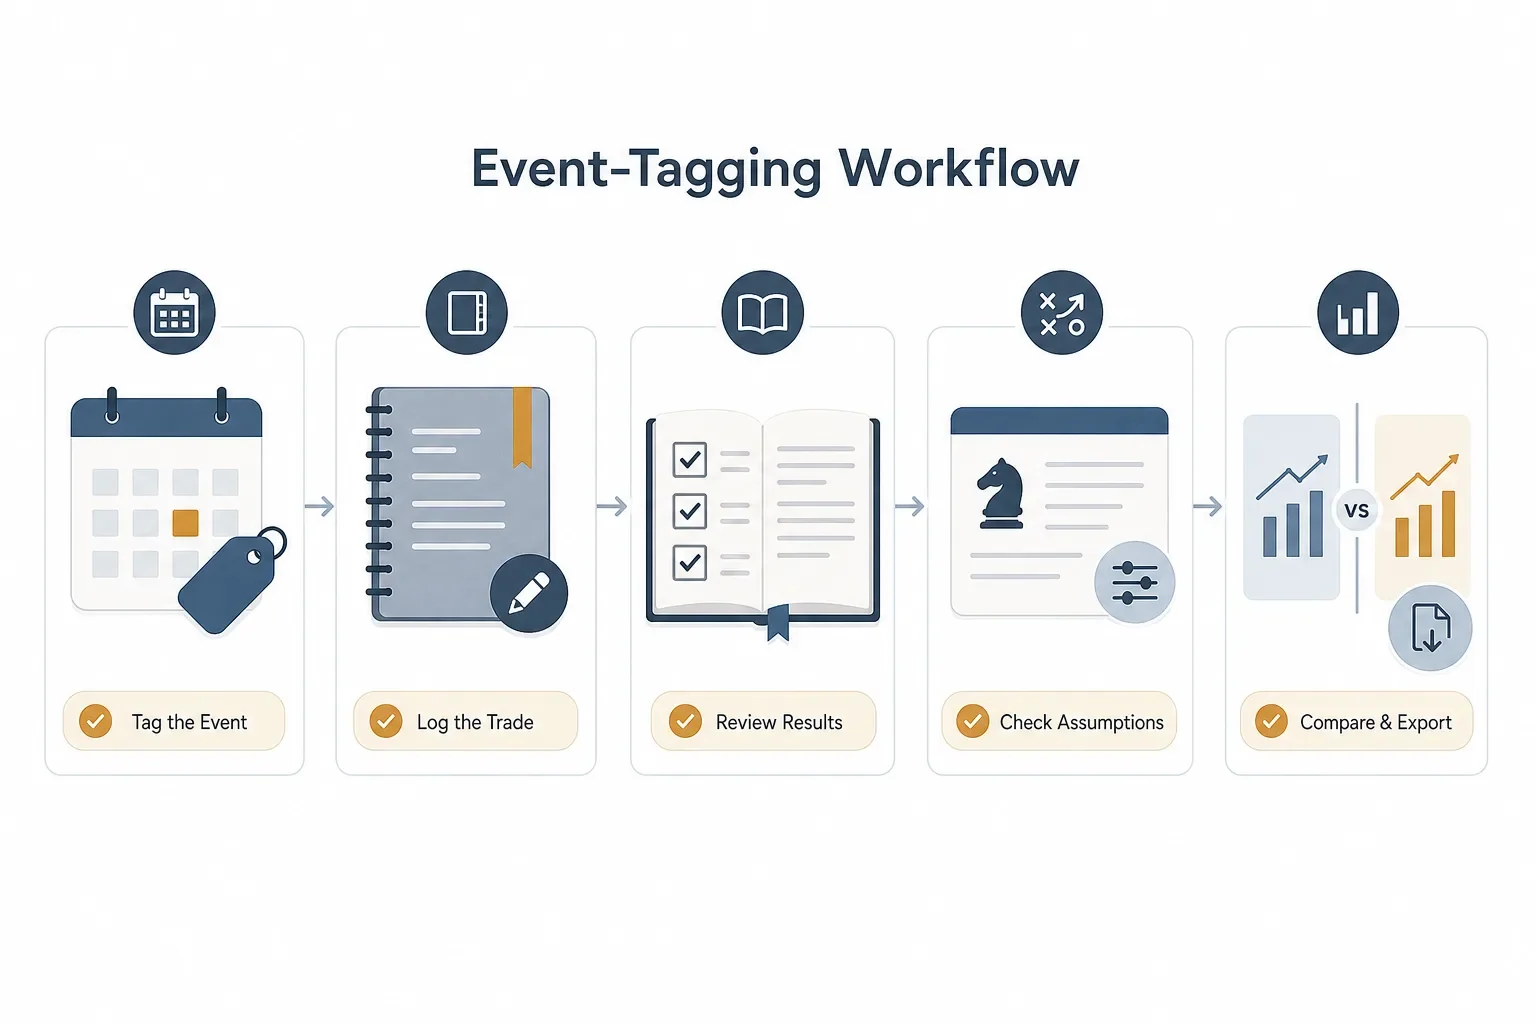
How to Audit Your Crypto Strategies After Earnings-Driven Volatility: A Step-by-Step Event-Tagging Workflow
A practical, step-by-step workflow to tag trades around earnings-driven crypto volatility, record outcomes in a Historical results journal, and use Strategy management and Strategy comparison to spot resilient rules.
 2026-08-11
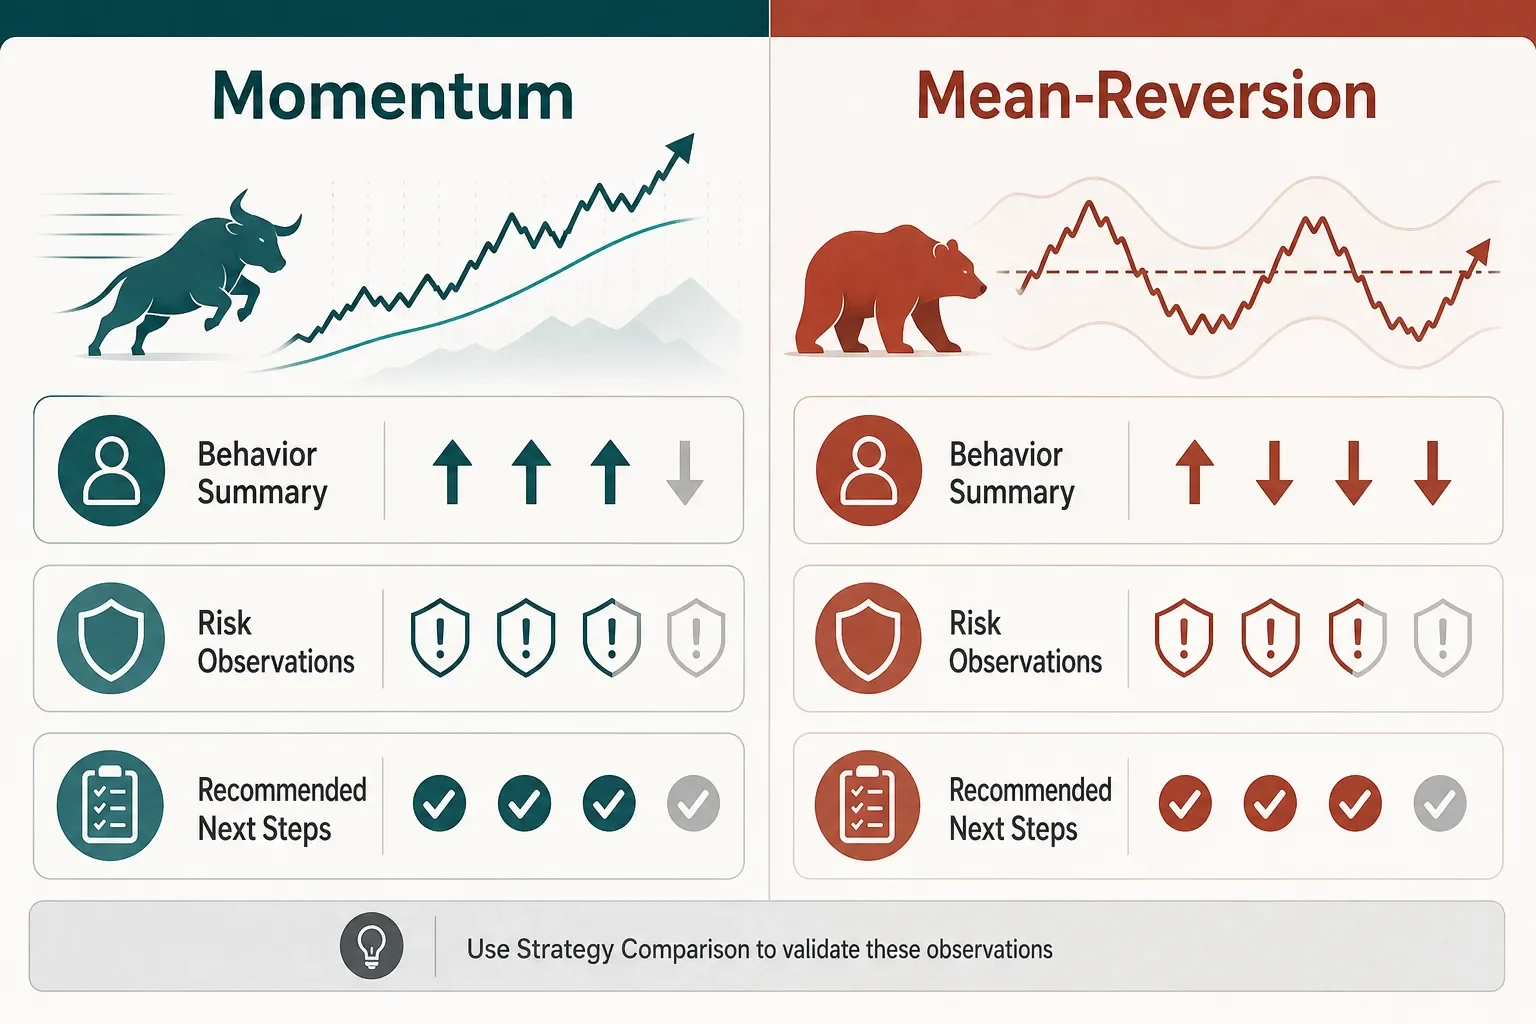
When Markets Decouple: A Trader’s Checklist for Post‑Event Strategy Reviews
A step‑by‑step playbook for post‑event reviews: capture hypotheses, tag trades by catalyst, log outcomes, and use Strategy Comparison to see what held up during the Korea chip crash vs. Bitcoin rally.
 2026-08-11
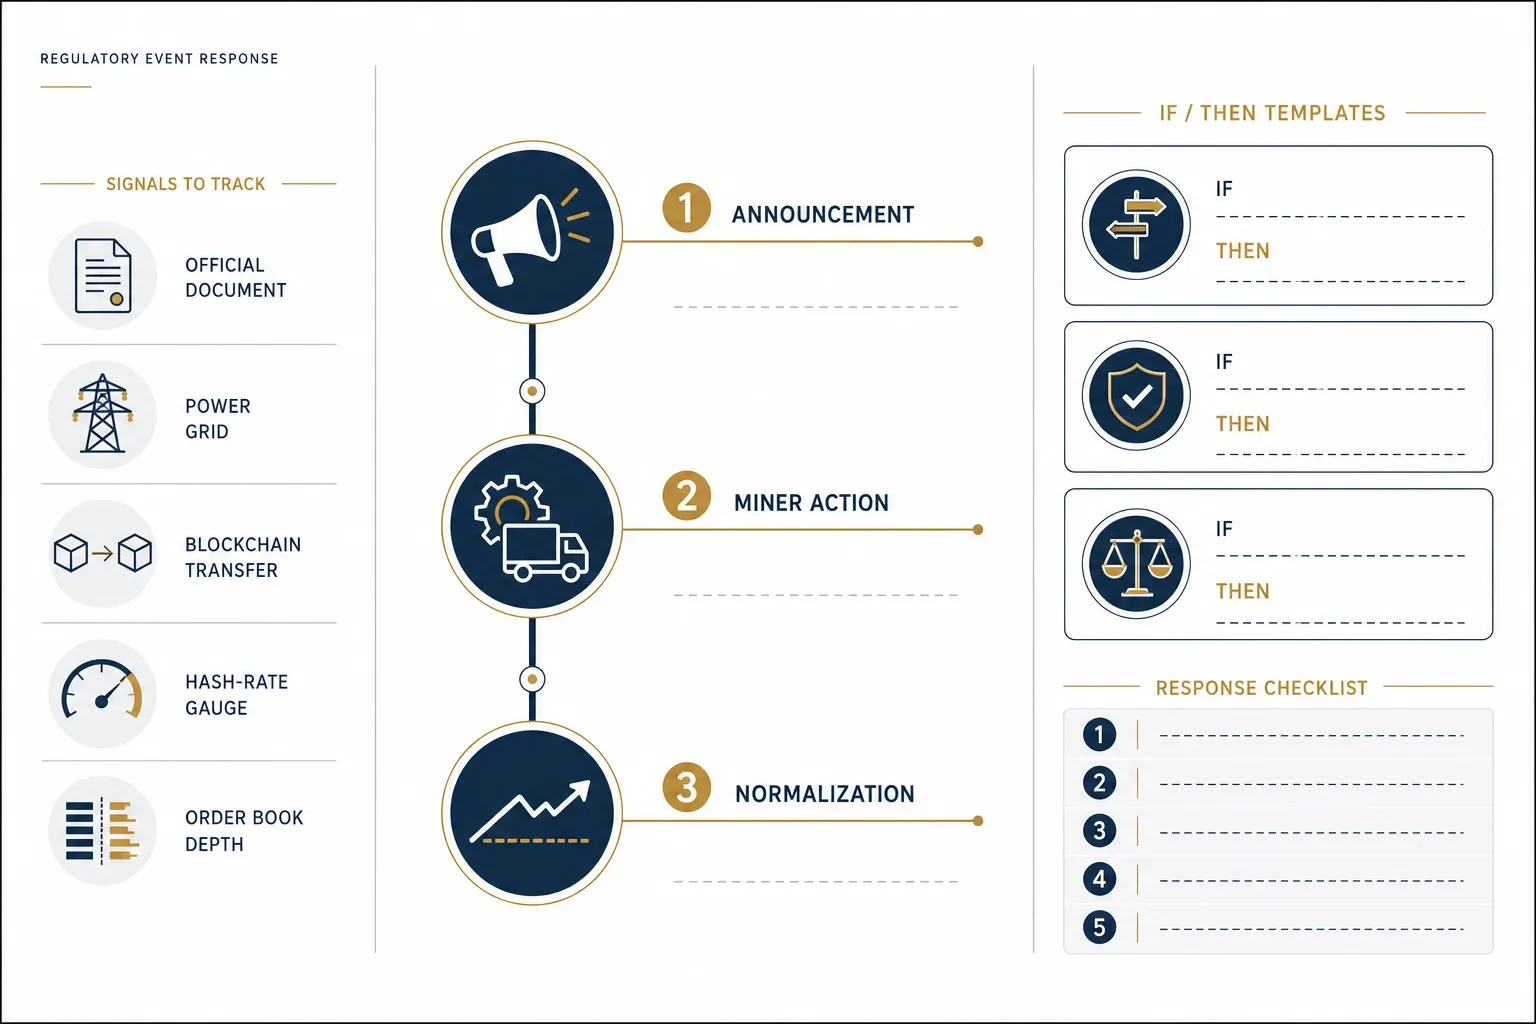
How Kazakhstan mining-policy reports change BTC’s short-term risk — an event-driven playbook
Reports that Kazakhstan considered mining rules tied to its national reserve highlight how jurisdictional policy can reallocate hash rate and create short-term BTC volatility. This playbook gives mechanics, if/then templates and a Regulatory Event Response checklist.