
When Markets Decouple: A Trader’s Checklist for Post‑Event Strategy Reviews
A step‑by‑step playbook for post‑event reviews: capture hypotheses, tag trades by catalyst, log outcomes, and use Strategy Comparison to see what held up during the Korea chip crash vs. Bitcoin rally.
# When Markets Decouple: A Trader’s Checklist for Post‑Event Strategy Reviews
Turn cross‑asset shocks into repeatable learning. When equities or macro sectors diverge from crypto—as in the example of a Korea chip crash while Bitcoin rose—traders who log hypotheses, tag trades by catalyst and run objective comparisons can identify which approaches are robust and which need rework. This guide gives a step‑by‑step workflow, templates you can copy into your strategy notes, and a short after‑action checklist you can use after any event.
## Why document an event‑driven review?
Events that create cross‑asset decoupling expose hidden assumptions in strategy design: correlation, beta to equities, liquidity sensitivity, and regime dependence. Without disciplined documentation you risk biasing post‑event explanations and missing repeatable improvements. An event‑driven strategy review helps you:
- Turn a single market surprise into process improvements.
- Separate noise from structural regime change.
- Compare rule sets objectively using historical outcomes.
Trade Strategy's Strategy Management, Historical Results Journal and Strategy Comparison help organize that work: create hypotheses, tag trades by catalyst, log outcomes, and compare strategy performance across labeled regimes.
## Step‑by‑step workflow
### 1) Capture the event and initial hypothesis (T+0)
Create a new entry in Strategy Management for the event. Treat this as an explicit hypothesis: what do you expect to happen to each asset class and to your strategies?
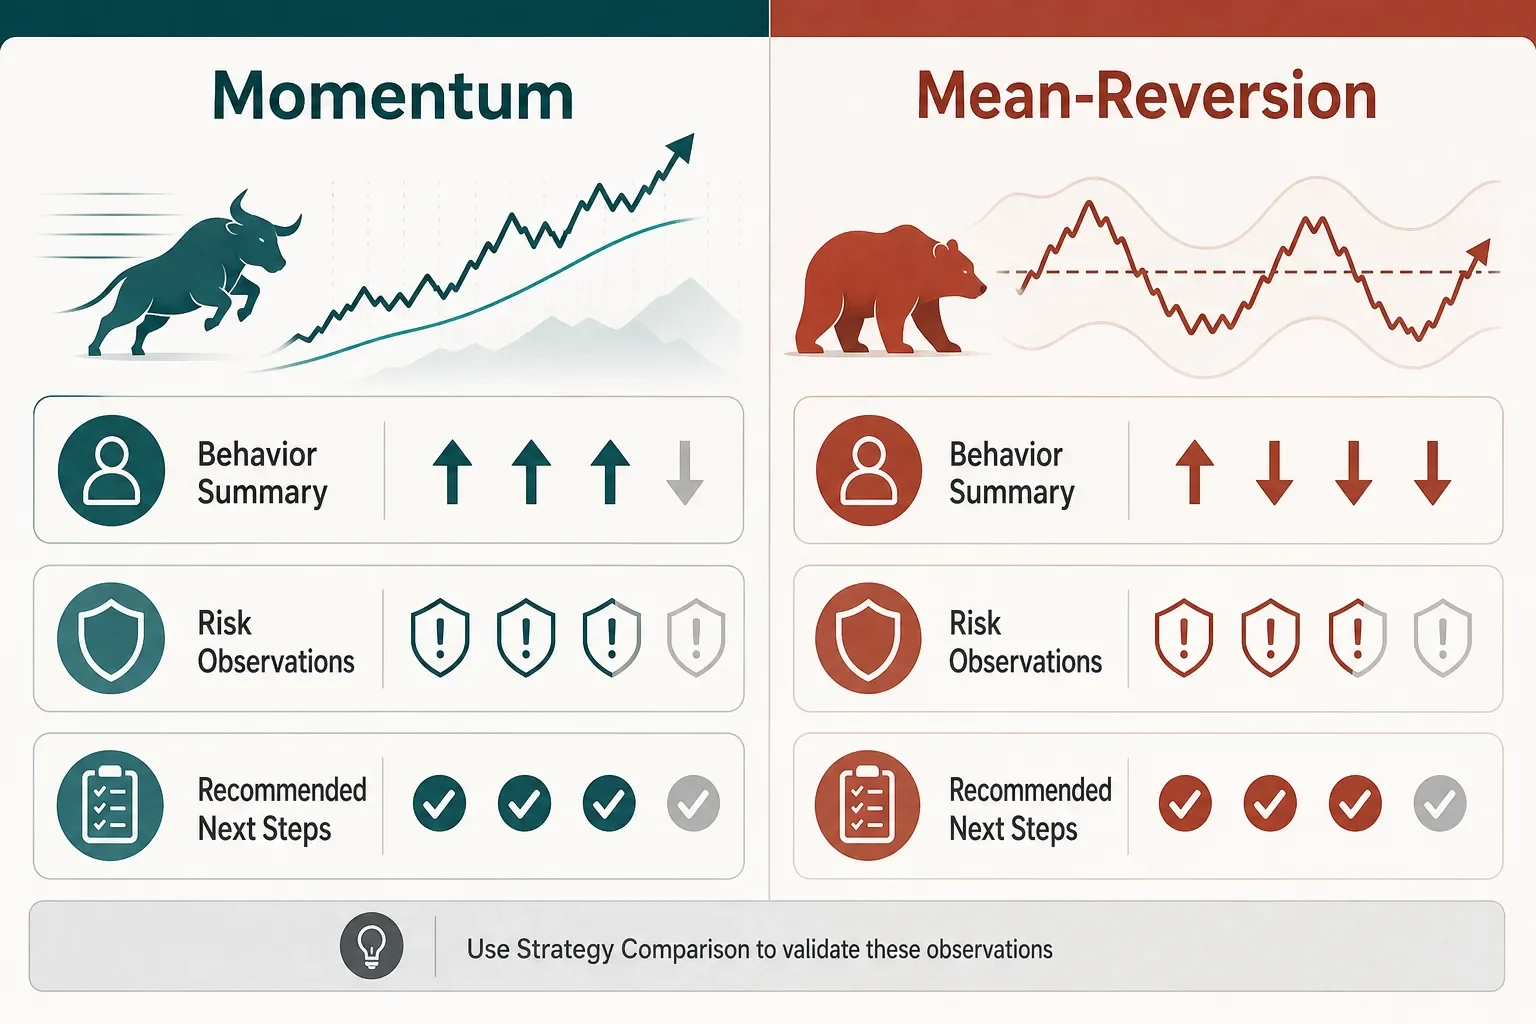
Example hypothesis (Korea chip crash vs BTC rally): “Chip sector sell‑off reduces equity beta. BTC appears to be driven by macro liquidity and on‑chain flows—my momentum strategy should remain intact, but high‑leverage mean‑reversion may suffer during cross‑asset rotations.”
Record the assumption, time window, and key indicators you’ll monitor (correlation, funding rates, volume, equity indices).
### 2) Tag active and new trades by catalyst
Use a consistent tag convention so later searches and filters are reliable. Tag both pre‑existing positions and trades opened after the event.
Suggested tag examples:
- event:korea-chip-crash
- catalyst:macro‑liquidity
- regime:decoupled
Record the reason for each trade and whether it’s an active response to the event or part of a standing strategy.
### 3) Log outcomes in the Historical Results Journal (T+1 to T+30)
For each tagged trade, record entry/exit, realized/unrealized P&L, drawdown, and a short note on whether the trade behaved as expected. Over a 1–4 week window you’ll have enough outcomes to compare performance across strategies and regimes without jumping to conclusions.
### 4) Run Strategy Comparison across the labeled regime
Use Strategy Comparison to filter for trades and results that carry the event tag or fall inside the event time window. Compare core metrics side by side: returns, max drawdown, win rate, average duration, and tail outcomes.
Practical interpretation:
- If momentum strategies show consistent returns and limited drawdown while mean‑reversion shows deeper drawdowns, you have evidence to reweight or adjust risk parameters.
- If all strategies underperform, the event may indicate increased systemic risk or a liquidity shock requiring risk reduction.
### 5) Iterate rules and create controlled tests
Translate observations into testable rule changes: tighten stop logic, increase time‑frame confirmation, or add a correlation‑based filter. Create a new strategy variant in Strategy Management with the exact rule changes and track it as a separate strategy in the Historical Results Journal.
## Practical templates (copy into your notes)
Hypothesis Template
| Field | Example |
|---|---|
| Event name | Korea chip crash (date) |
| Primary hypothesis | Momentum on BTC remains intact despite equity weakness |
| Key indicators | BTC price, BTC 4H trend, KOSPI, semiconductor ETF, funding rate |
| Time window | 14–30 days |
| Action plan | Tag trades, limit position size, run comparison at T+14 |
Trade Tagging Quick Table
| Trade ID | Strategy | Tag(s) | Entry | Exit | Note |
|---|---:|---|---:|---:|---|
| 2026-07-29-001 | BTC Momentum | event:korea-chip-crash, regime:decoupled | 62,200 | 63,800 | Held through rotation |
## After‑Action Checklist (short)
- Did we record the original hypothesis in Strategy Management? If not, do it now.
- Are all trades during the event properly tagged? Tag historical trades before analysis.
- Have we allowed an observation window (e.g., 14 days) before final judgment?
- What does Strategy Comparison show for returns, drawdown and duration across strategies?
- Which change can we A/B test next (stop rules, position sizing, timeframe)?
## Interpreting results and using AI recommendations responsibly
If you’re on the Elite plan, Trade Strategy’s AI‑powered recommendations can analyze strategy performance, trade history and parameters to suggest specific improvements. These recommendations are intended as probabilistic decision‑support—use them to prioritize tests and rule changes, not as guarantees.
The product roadmap also includes planned probabilistic BTC direction suggestions as additional decision‑support; treat any such signals as inputs, not certainties.
## Conclusion
Cross‑asset decoupling events are opportunities: disciplined documentation, consistent tagging and objective comparison turn surprises into repeatable learning. Use Strategy Management to capture hypotheses, the Historical Results Journal to record outcomes, and Strategy Comparison to measure which rules survived the shock. Run controlled tests on variants you create and treat AI recommendations as probabilistic support when available.
Try the workflow yourself: adopt the checklist above, paste the templates into your strategy notes, and run a comparison after the next event to learn what truly holds up.
Try for free: https://trade-strategy.com
 2026-08-11
How to Backtest Crypto Strategies Against Rising Rates and Oil Shocks — A Practical Template
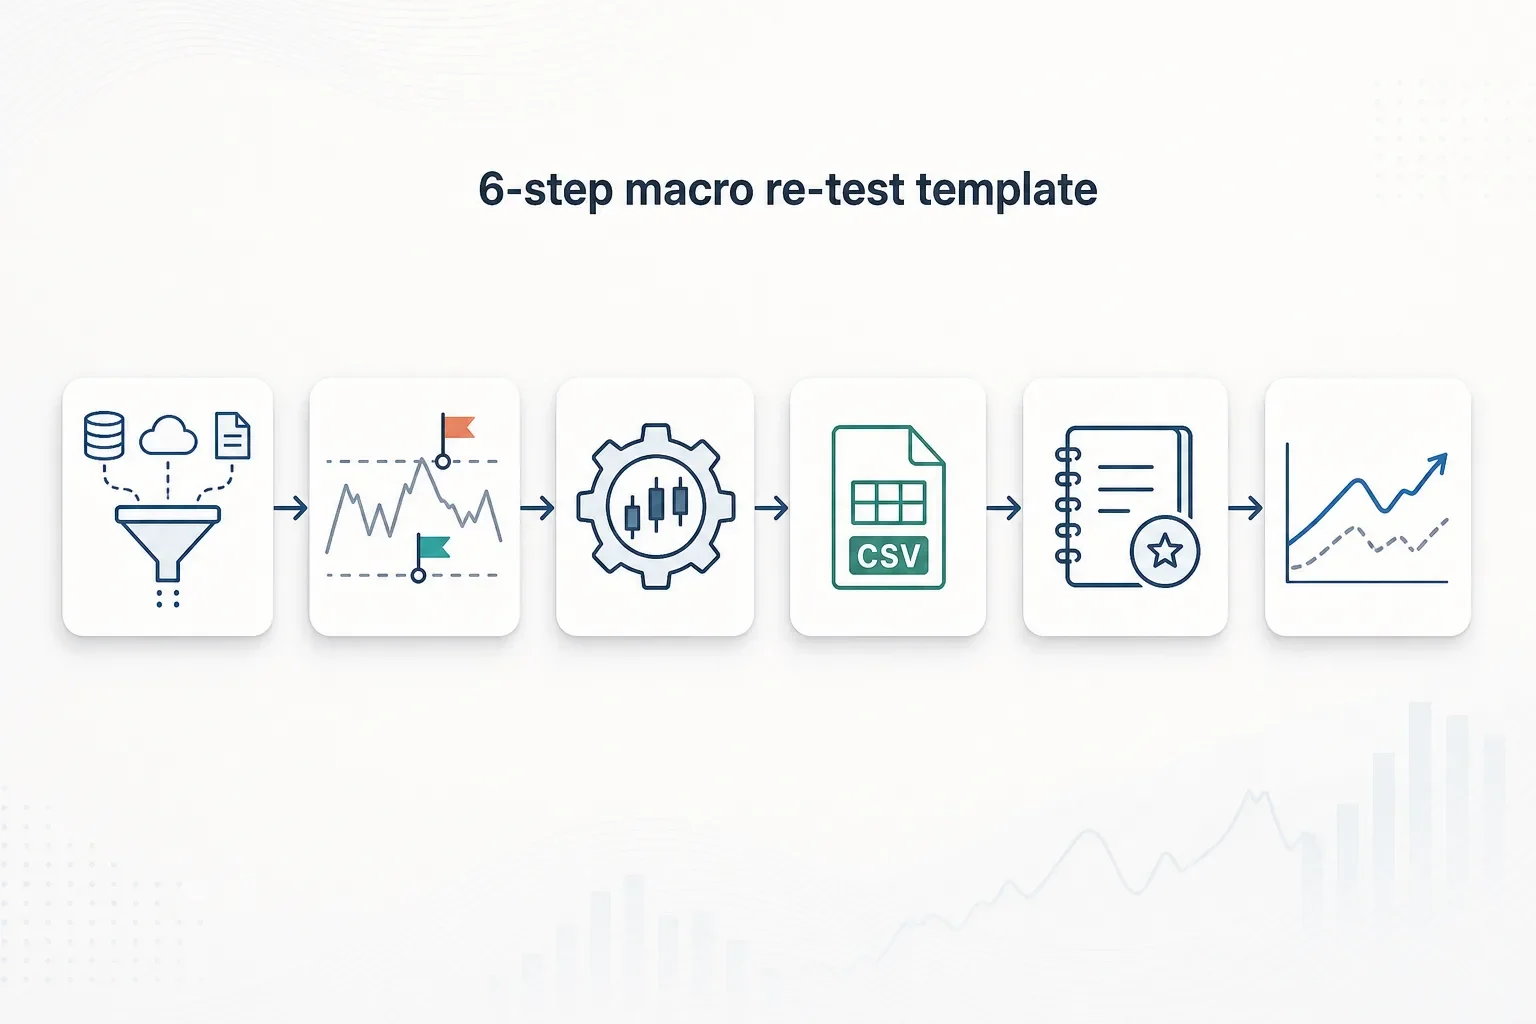
A hands-on template for re-testing crypto strategies when rates and oil spike: ingest macro time series, run variant backtests, record results in Trade Strategy, and compare outcomes to adapt sizing rules.
 2026-08-11
How to Audit Your Crypto Strategies After Earnings-Driven Volatility: A Step-by-Step Event-Tagging Workflow
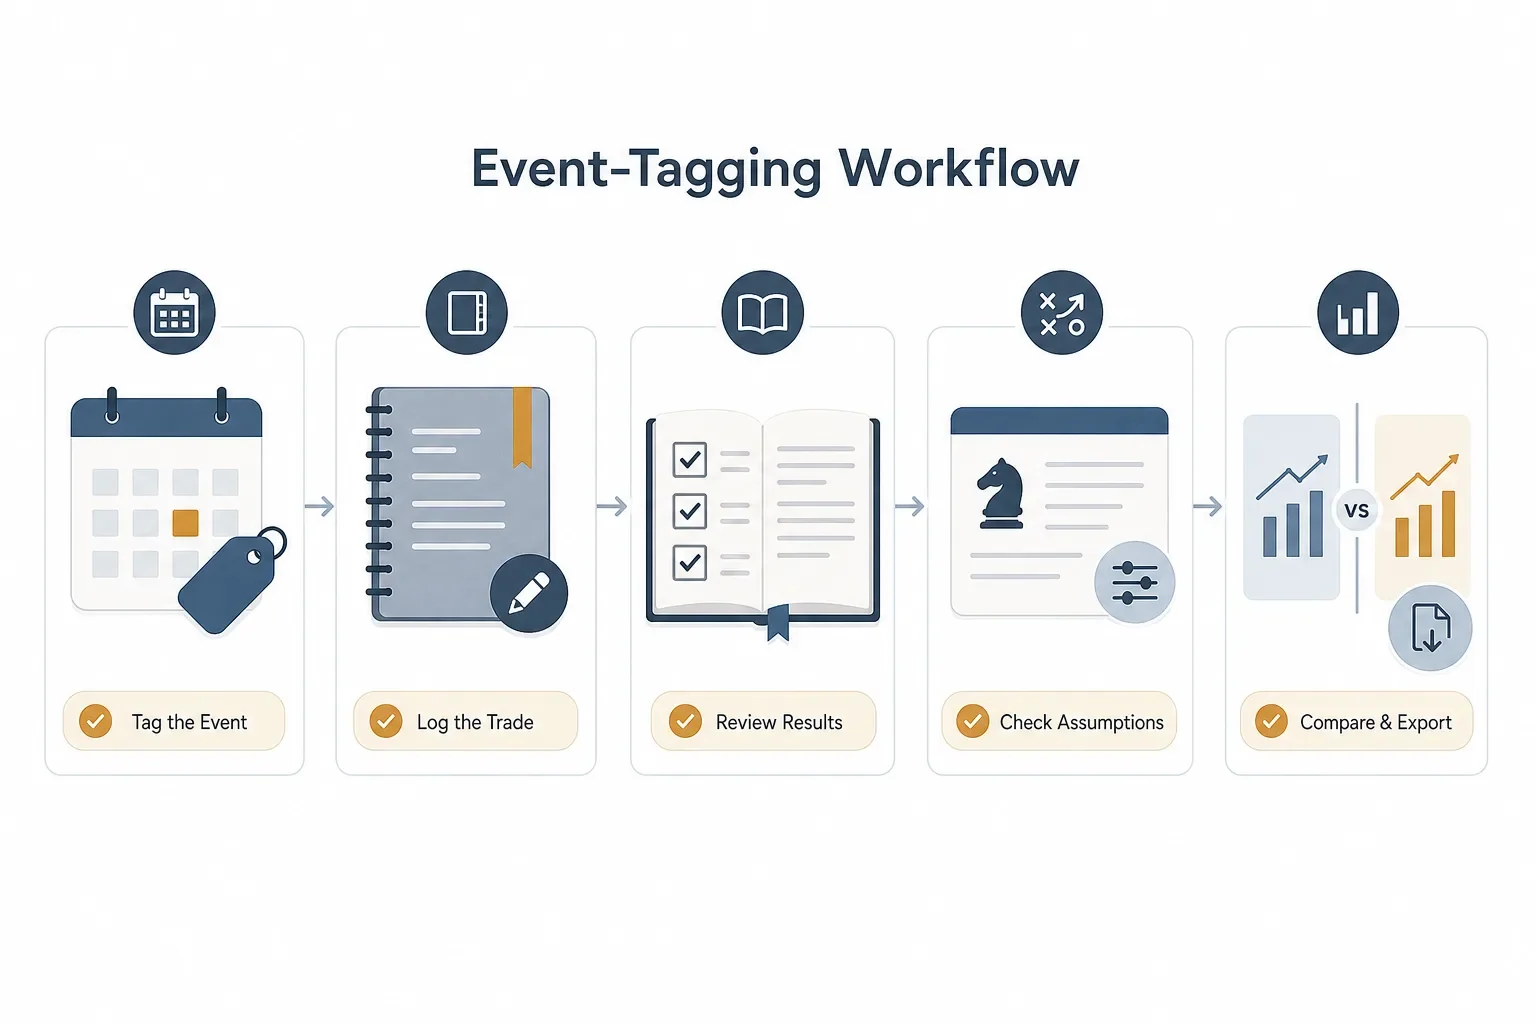
A practical, step-by-step workflow to tag trades around earnings-driven crypto volatility, record outcomes in a Historical results journal, and use Strategy management and Strategy comparison to spot resilient rules.
 2026-08-11
When AI Flows Cool and Crypto Breaks Out: A Practical Playbook for Regime-Shift Trading
A practical playbook for detecting and responding to regime shifts when AI-driven flows cool and crypto potentially breaks out. Steps to detect, tag, re-test and compare strategies using Trade Strategy's released features.