
How to Audit Your Crypto Strategies After Earnings-Driven Volatility: A Step-by-Step Event-Tagging Workflow
A practical, step-by-step workflow to tag trades around earnings-driven crypto volatility, record outcomes in a Historical results journal, and use Strategy management and Strategy comparison to spot resilient rules.
# How to Audit Your Crypto Strategies After Earnings-Driven Volatility: A Step-by-Step Event-Tagging Workflow
Turn the Dogecoin/ETH pullback into a learning moment — not guesswork. Short-term volatility around earnings and macro news frequently changes price behavior and correlations. A disciplined event-tagging workflow helps you separate luck from rule quality, document what happened, and make probabilistic, evidence-based adjustments.
This guide shows a practical, operational workflow you can implement immediately: how to tag earnings-driven events, record outcomes in the Historical results journal, and use Strategy management plus Strategy comparison to identify resilient rules. A downloadable event-tagging checklist and post-event review template are available at the end.
## Why event tagging matters after earnings-driven moves
Earnings cycles compress information into short windows. Reactions can be noisy and may temporarily break assumptions (e.g., correlation patterns, volatility regimes, liquidity). If you don’t mark trades and results against those events, you may incorrectly change or abandon strategies based on noise.
Event tagging gives you structured data: which trades happened during the event window, which rules were active, and how outcomes differed from baseline periods. That structure makes strategy comparison meaningful.
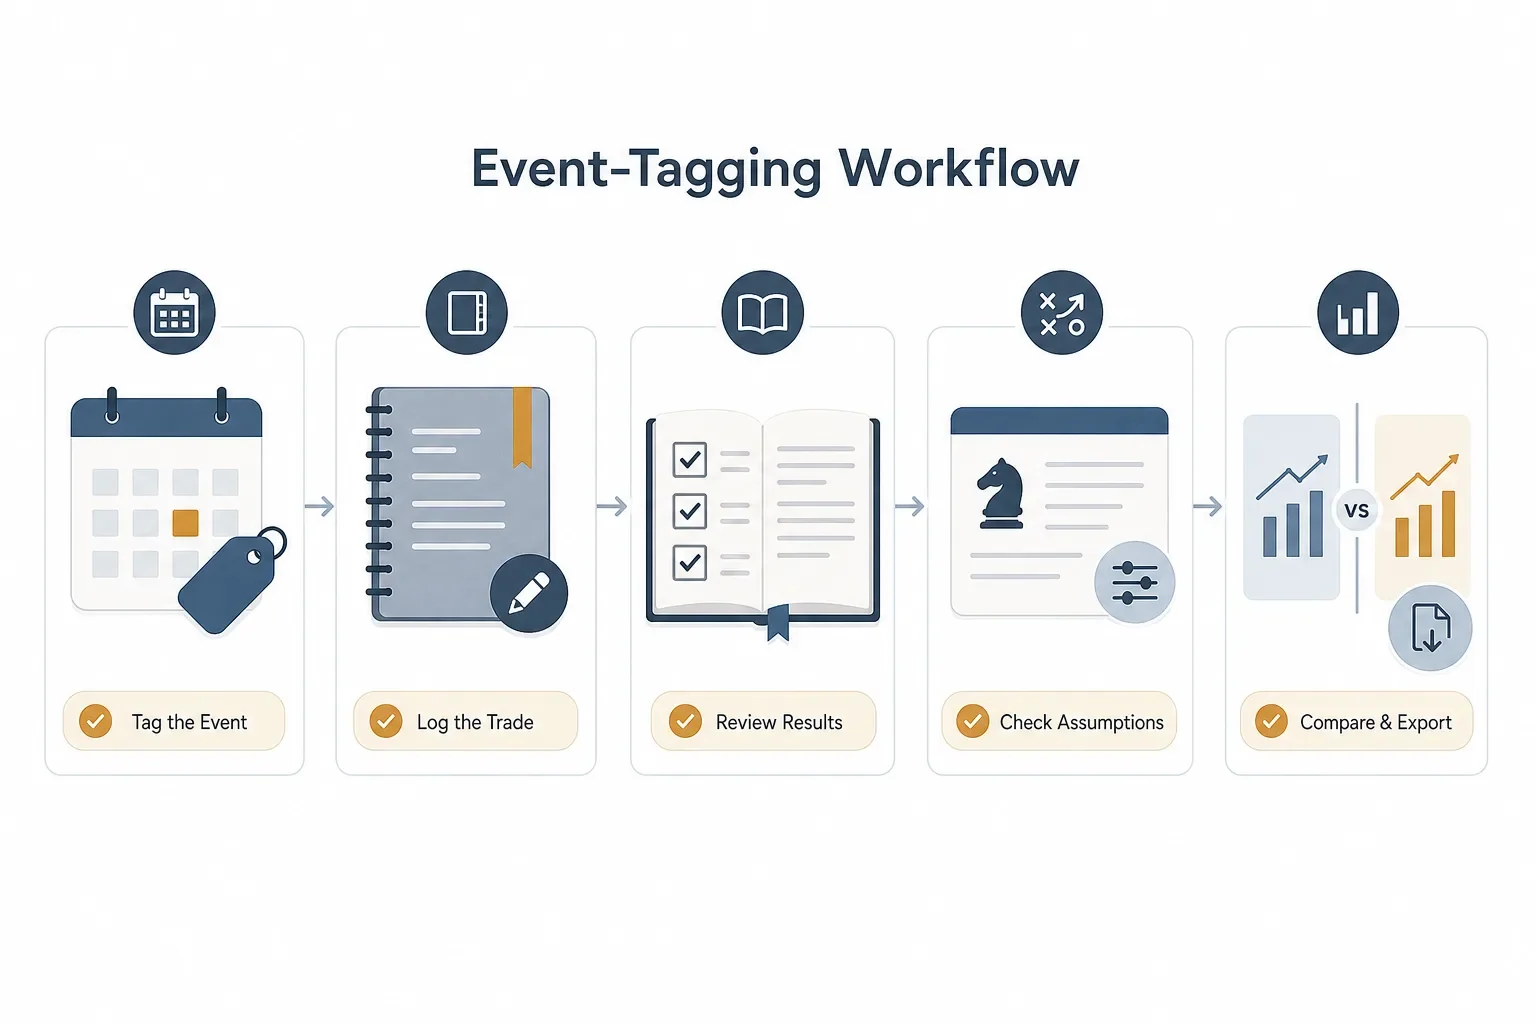
## Quick overview of the workflow
1. Define the event window and tag trades.
2. Record outcomes and context in the Historical results journal.
3. Use Strategy management to document rules and assumptions before/after the event.
4. Run Strategy comparison across event and baseline windows to identify resilient rules.
5. Capture decisions in a post-event review and schedule follow-ups.
Below are practical steps, examples, and a short case study comparing two hypothetical strategies during the Dogecoin/ETH pullback.
## Step 1 — Define the event and tagging convention
### Choose event timing
- Event start: the time earnings were released or the first material market reaction.
- Event end: define a fixed window (common choices: intraday, 24–72 hours, 1 week) depending on how long the market digests the news.
### Create standard tags
Use short, consistent tags so you can filter and aggregate later. Examples:
- earnings-tech-2026-07-24
- earnings-tech-window-24h
- correlation-break
Record the tag meaning in your Strategy management entry so everyone using the system understands the window and rationale.
## Step 2 — Tag trades and positions in your journal
### What to tag
- Every trade executed during the event window (entry/exit)
- Existing open positions whose stop-losses, scaling or hedges were adjusted during the event
- Relevant alerts or discretionary overrides
### Minimum fields to capture in the Historical results journal
- Strategy name (link to Strategy management entry)
- Event tag(s)
- Trade metadata: entry time, exit time, instrument
- Decision notes: why the trade was taken or altered
- Emotional/context notes: discretionary override, liquidity issues, slippage
These fields let you separate mechanical rule performance from discretionary interventions.
## Step 3 — Document strategy rules and assumptions
Before you interpret outcomes, ensure the Strategy management record for each strategy is current. Include:
- Entry and exit rules
- Position sizing method and risk controls
- Assumptions (e.g., “assumes low cross-asset correlation” or “uses implied volatility mean reversion”)
- Known edge conditions and limits (market hours, liquidity minimums)
If you modified rules for the event (e.g., widen stops, reduce size), document the temporary rule and the reason.
## Step 4 — Compare strategies across event and baseline windows
### What to compare
For each strategy, compare outcomes during the event window to a baseline period (same calendar length during normal conditions). Key dimensions:
- Trade frequency (did the strategy trigger more or fewer trades?)
- Execution quality (slippage, fill rates)
- Risk realization (maximum drawdown, realized volatility of returns)
- Rule failures (instances where a rule produced an unwanted exposure)
- Discretionary interventions (how often rules were overridden)
Use Strategy comparison to view these dimensions side-by-side. Focus on relative changes rather than absolute claims of performance.
### How to interpret differences
- If a strategy’s rules performed consistently but execution deteriorated (higher slippage), consider execution-focused fixes rather than changing signal logic.
- If a strategy consistently produced outsized losses during event windows, review rule assumptions (e.g., does it assume stable correlations?) and consider guardrails or temporary size limits around earnings.
- If a strategy’s trades were frequently manually overridden, document whether overrides improved outcomes; repeated overrides may indicate a rule mismatch or missing state input.
## Short case study: comparing two hypothetical strategies during the Dogecoin/ETH pullback
Scenario: A tech earnings release coincides with a rapid ETH-led pullback. You tagged the event window and captured trades for two strategies:
- Strategy A: systematic mean-reversion around short-term VWAP, small position sizes, tight stops.
- Strategy B: momentum breakout strategy, larger position sizes, uses moving-average cross for entries.
What to look for in the comparison (qualitative findings):
- Trade frequency: Strategy A triggered many small reversals as price oscillated; Strategy B had fewer but larger directional entries.
- Execution and slippage: The pullback widened spreads; Strategy B’s larger size experienced higher fill issues and partial fills.
- Risk outcomes: Strategy A’s tight stops limited single-trade losses but resulted in more small losses; Strategy B experienced longer drawdown chains when momentum didn’t resume.
- Rule signals vs discretionary changes: Traders overrode Strategy B twice to reduce size; those overrides coincided with improved realized outcomes.
Decision implications (example, not advice):
- Consider adding an earnings-event guardrail to Strategy B (reduce default size or require additional confirmation during tagged windows).
- Keep Strategy A’s size and stops but test widening the stop slightly to reduce chop-driven whipsaws during extreme volatility.
- Document these planned rule changes and schedule another tagged-window review.
## Step 5 — Run a post-event review and schedule follow-up
Use the post-event review template to record:
- Summary of outcomes and differences from baseline
- Hypotheses about why outcomes occurred (liquidity, correlation shifts, execution)
- Concrete next steps (e.g., reduce size in event windows, add volatility filter, update risk controls)
- Who will implement and a target review date
Treat this as a living checklist: tag the next earnings window and measure whether the changes reduced unwanted outcomes.
## Practical tips and common pitfalls
- Be consistent: identical tags and window definitions make aggregation meaningful.
- Tag conservatively: if unsure whether a reaction is event-driven, include the tag and note uncertainty in the journal.
- Separate mechanical results from discretionary notes so you can analyze rule performance cleanly.
- Don’t overreact to a single event — look for reproducible patterns across multiple tagged windows.
## Templates and checklist
We’ve prepared an event-tagging checklist and a post-event review template you can download and adapt. The pack includes a sample tagging convention, a journal entry template, and a post-event worksheet to capture hypotheses and action items.
Download the checklist and templates, then try Strategy management and the Historical results journal on Trade Strategy: https://trade-strategy.com/blog
## Conclusion
Earnings-driven volatility is messy, but it’s also an opportunity to learn. A repeatable event-tagging workflow—combined with disciplined documentation in your Historical results journal and structured Strategy management—turns ad-hoc reactions into data you can analyze. Use Strategy comparison to find rules that hold up across regimes, and treat any changes as probabilistic improvements rather than guarantees.
Download the checklist and templates and use them to run a first post-event audit after the next earnings cycle. Keep tags, notes and comparisons consistent — that historical record is the asset that improves decision-making over time.
---
If you want the templates and a short walkthrough, grab the pack and a step-by-step demo at: https://trade-strategy.com/blog
 2026-08-11
When AI Flows Cool and Crypto Breaks Out: A Practical Playbook for Regime-Shift Trading
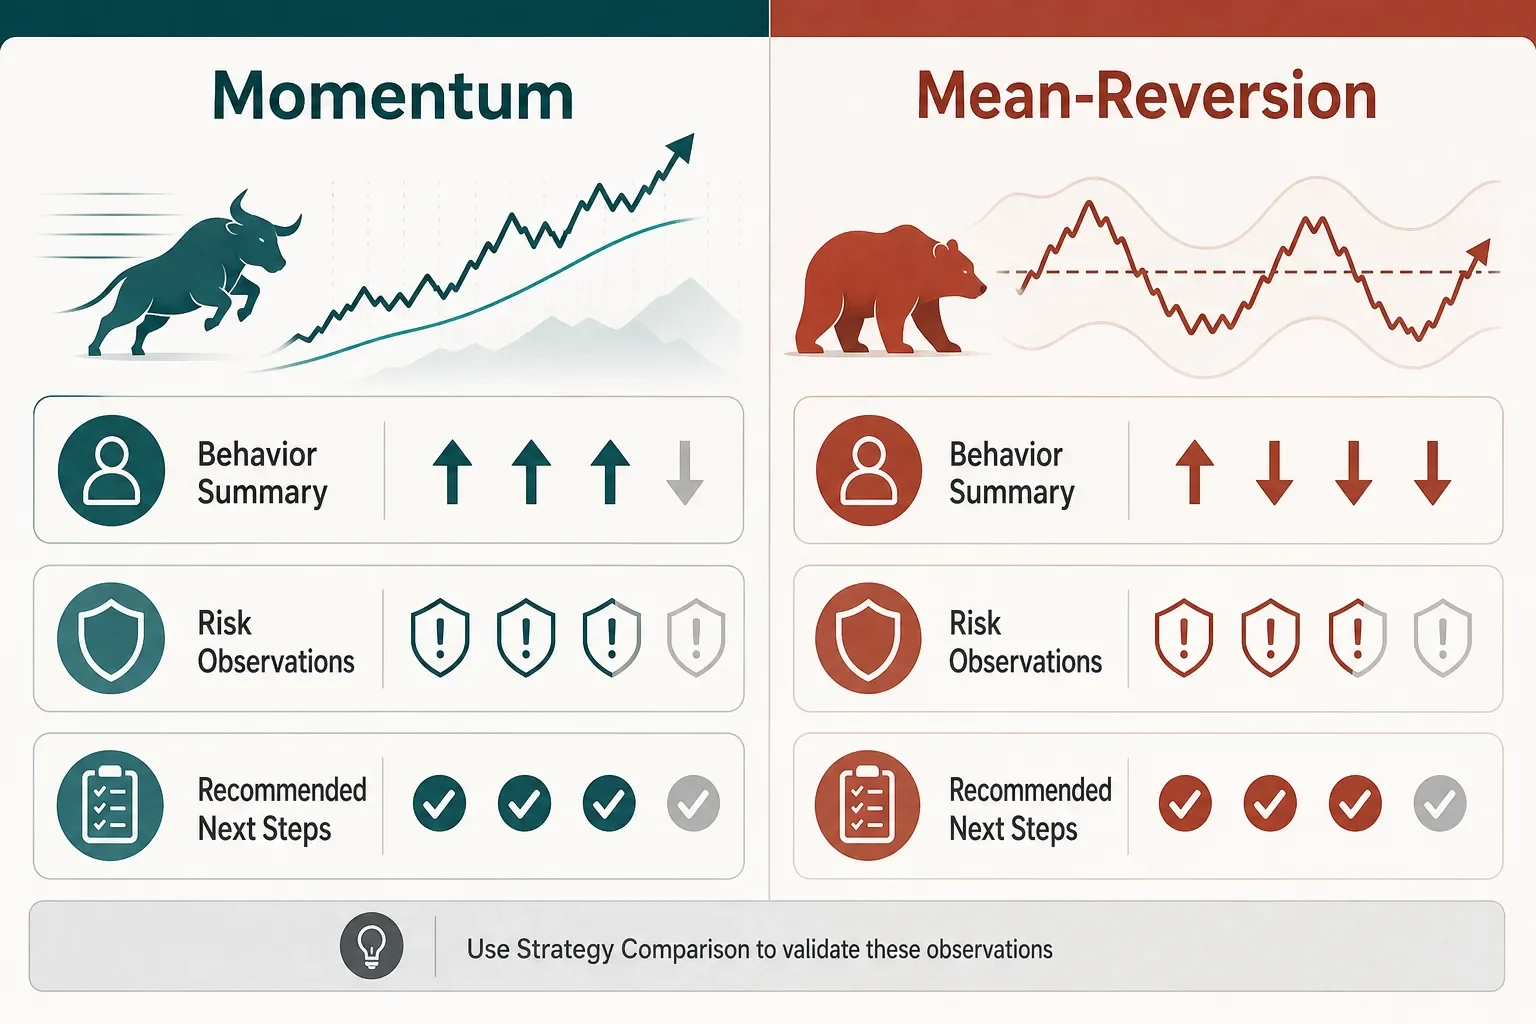
A practical playbook for detecting and responding to regime shifts when AI-driven flows cool and crypto potentially breaks out. Steps to detect, tag, re-test and compare strategies using Trade Strategy's released features.
 2026-08-11
When Markets Decouple: A Trader’s Checklist for Post‑Event Strategy Reviews
A step‑by‑step playbook for post‑event reviews: capture hypotheses, tag trades by catalyst, log outcomes, and use Strategy Comparison to see what held up during the Korea chip crash vs. Bitcoin rally.
 2026-08-11
How Kazakhstan mining-policy reports change BTC’s short-term risk — an event-driven playbook
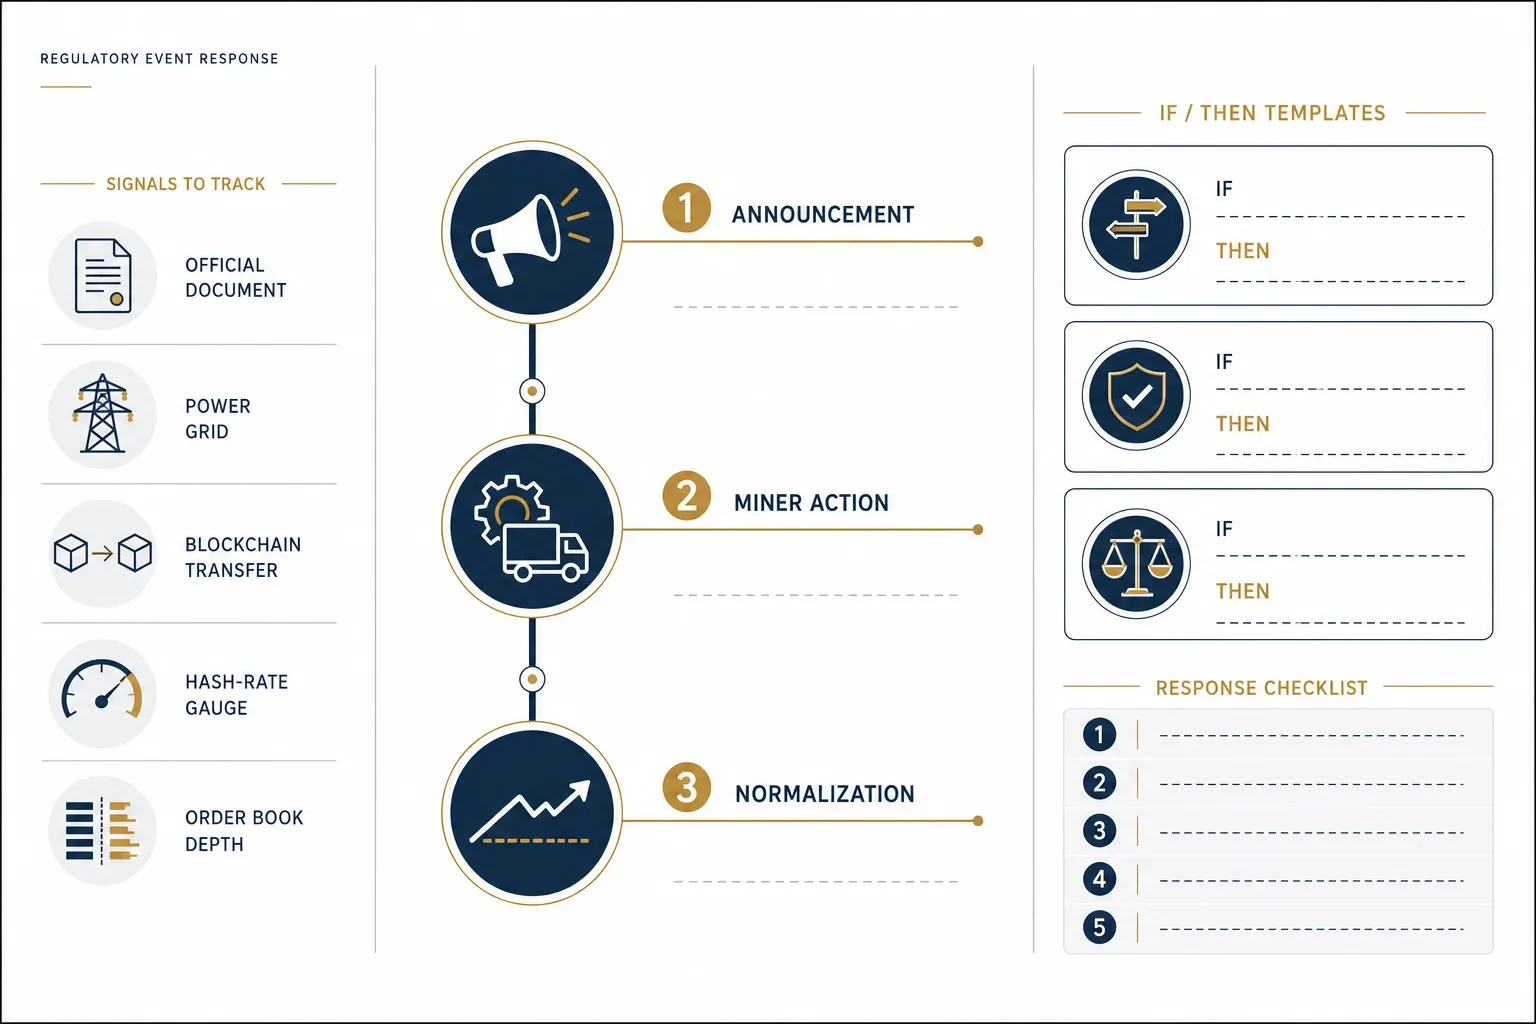
Reports that Kazakhstan considered mining rules tied to its national reserve highlight how jurisdictional policy can reallocate hash rate and create short-term BTC volatility. This playbook gives mechanics, if/then templates and a Regulatory Event Response checklist.