
EMA 10/30 Crossover Strategy: A Beginner-Friendly Guide with Examples and Backtest Results
Learn how the EMA 10/30 crossover strategy works with real BTC/USD examples, historical backtest results, performance metrics, advantages, risks, and practical tips for beginner traders.
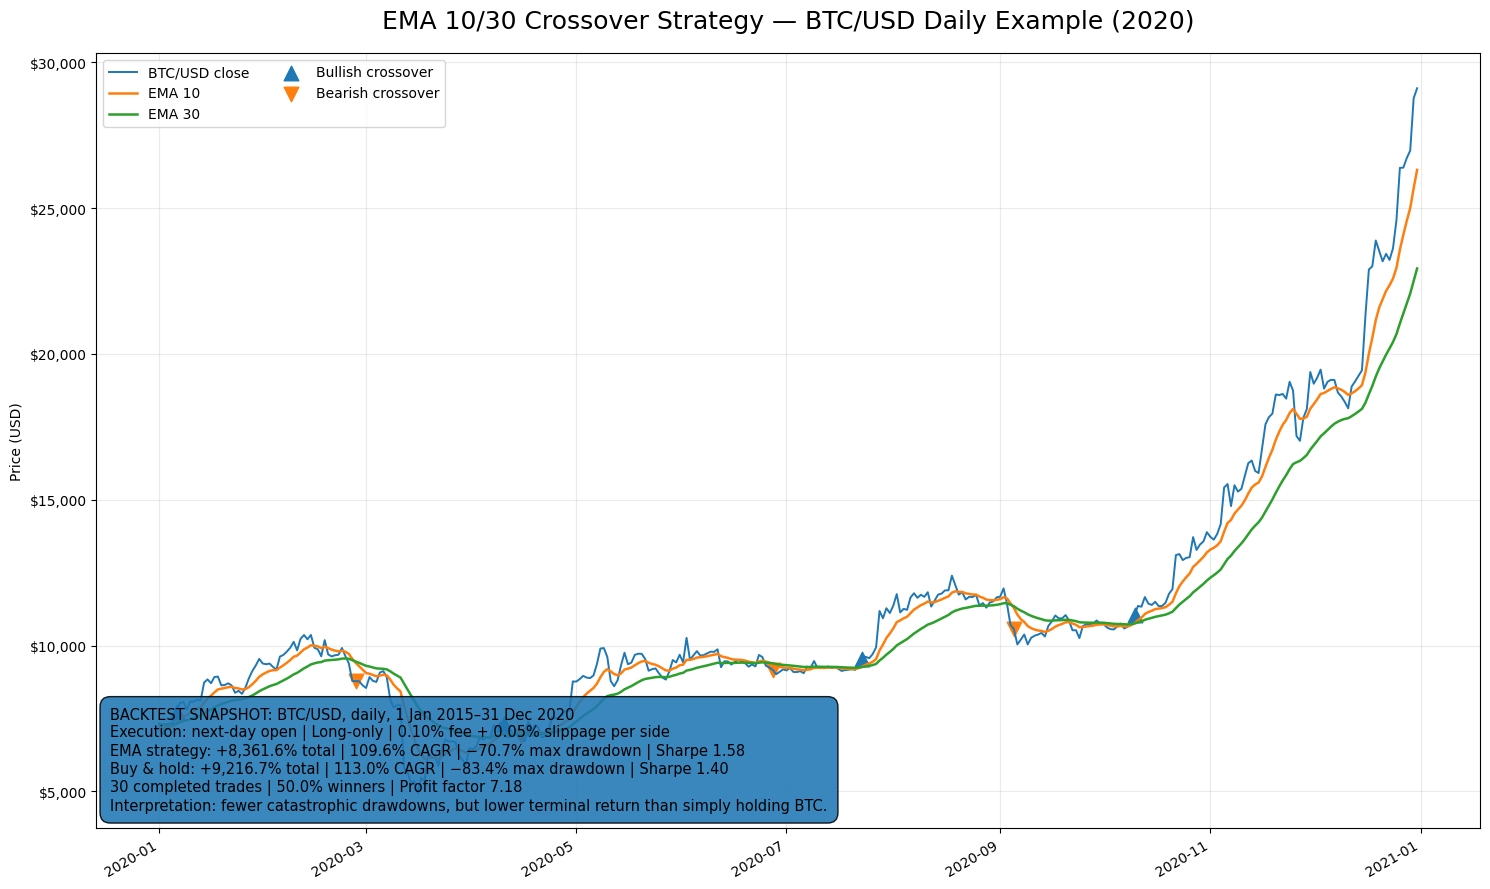
The EMA 10/30 crossover strategy is a simple trend-following system that uses two exponential moving averages to identify potential changes in market direction. It is commonly used by beginner traders because its rules are easy to understand, signals are objective, and the strategy can be tested on almost any liquid market.
However, simplicity should not be confused with guaranteed profitability. An EMA crossover does not predict the future. It reacts to price movements that have already occurred. Its purpose is to help a trader participate in sustained trends while accepting that some signals will produce small losses.
This article explains how the EMA 10/30 crossover works, provides concrete historical examples using Bitcoin, presents the results of a rules-based backtest, and discusses the strategy’s most important advantages and limitations.
What Does EMA 10/30 Mean?
EMA stands for Exponential Moving Average.
A moving average calculates the average price over a selected number of periods. Unlike a Simple Moving Average, an EMA gives more weight to recent prices. As a result, it responds faster when market conditions change.
The strategy uses two averages:
- EMA 10: the fast average, calculated from the last 10 candles.
- EMA 30: the slow average, calculated from the last 30 candles.
On a daily chart, EMA 10 represents approximately two trading weeks in traditional markets, while EMA 30 represents approximately six weeks. Cryptocurrency markets trade seven days per week, so these periods represent 10 and 30 calendar days when applied to daily Bitcoin candles.
The fast EMA reacts more quickly to price changes. The slower EMA moves more gradually and represents the broader trend.
Basic EMA 10/30 Trading Rules
Entry Rule
A bullish signal appears when EMA 10 crosses above EMA 30.
This is called a bullish crossover. It indicates that recent prices are rising faster than the longer-term average, which may signal the beginning or continuation of an upward trend.
The trader enters a long position after the crossover has been confirmed.
Exit Rule
A bearish signal appears when EMA 10 crosses below EMA 30.
This suggests that short-term momentum has weakened. The trader closes the long position and remains in cash until another bullish crossover occurs.
An important implementation detail is that the crossover should be confirmed only after the candle has closed. Entering before the close introduces the risk that the averages will cross temporarily and then reverse before the candle is completed.
In a realistic backtest, a signal generated at today’s closing price cannot be executed at that same closing price unless a special closing auction or market-on-close mechanism is available. For that reason, the backtest presented below executes each signal at the next day’s opening price.
Historical Example: Bitcoin in 2020
Bitcoin’s price behaviour during 2020 provides a useful example of both the strengths and weaknesses of the EMA 10/30 strategy.
At the beginning of the year, Bitcoin moved through several short-lived directional phases. The two EMAs crossed repeatedly, producing signals that were sometimes quickly reversed. This is typical of a sideways or unstable market and is commonly described as a whipsaw environment.
During these periods, the strategy produced several small losing trades.
The situation changed later in the year. In October 2020, EMA 10 moved decisively above EMA 30 as Bitcoin began a strong upward trend. According to the tested rules, the strategy entered near an opening price of approximately $11,060 on October 11, 2020.
The position remained open until the end of the tested period and was valued near $27,349 on December 30, 2020. After estimated trading fees and slippage, this individual trade generated a return of approximately 146.5%.
This example illustrates the typical return distribution of a trend-following strategy:
- several small losses,
- several modest gains,
- and a small number of unusually large winning trades.
The large winning trades are expected to compensate for the unsuccessful entries. Therefore, judging the strategy after only three or four trades is statistically meaningless.
 EMA 10/30 crossover signals on the BTC/USD daily chart. The chart shows the Bitcoin closing price, EMA 10, EMA 30, bullish crossovers, bearish crossovers and selected backtest results.
Backtest Methodology
The following backtest used daily BTC/USD historical price data covering the period from January 1, 2015, through December 31, 2020.
The testing assumptions were:
| Parameter | Backtest Assumption |
|---|---|
| Market | BTC/USD |
| Timeframe | Daily candles |
| Test period | January 1, 2015–December 31, 2020 |
| Strategy type | Long-only |
| Entry | EMA 10 crosses above EMA 30 |
| Exit | EMA 10 crosses below EMA 30 |
| Signal calculation | After daily candle close |
| Execution | Next day’s opening price |
| Trading fee | 0.10% per transaction |
| Estimated slippage | 0.05% per transaction |
| Position size | 100% of available capital |
| Leverage | None |
| Stop-loss | None |
| Reinvestment | All profits and losses compounded |
Using the next candle’s opening price is important because it prevents look-ahead bias. The backtest does not assume that a trader could see the final crossover signal and simultaneously execute at a price that occurred before the signal was fully confirmed.
Backtest Results
The following results are based on an initial value of 1.00, with all returns reinvested.
| Metric | EMA 10/30 Strategy | Buy and Hold |
|---|---|---|
| Total return | 8,361.6% | 9,216.7% |
| Compound annual growth rate | 109.6% | 113.0% |
| Maximum drawdown | -70.7% | -83.4% |
| Annualized Sharpe ratio | 1.58 | 1.40 |
| Completed strategy trades | 30 | 1 continuous position |
| Winning trades | 50.0% | Not applicable |
| Profit factor | 7.18 | Not applicable |
| Best completed trade | 220.3% | Not applicable |
| Worst completed trade | -17.9% | Not applicable |
The yearly results provide additional context.
| Year | EMA 10/30 Return | Buy-and-Hold Return |
|---|---|---|
| 2015 | 62.8% | 37.1% |
| 2016 | 95.6% | 124.1% |
| 2017 | 572.1% | 1,271.4% |
| 2018 | -52.4% | -71.7% |
| 2019 | 113.2% | 94.4% |
| 2020 | 289.4% | 302.1% |
These results require careful interpretation.
The EMA strategy did not outperform buy and hold in terms of final wealth. It generated a lower total return and a slightly lower compound annual growth rate.
Its main advantage was risk reduction. The maximum historical drawdown decreased from approximately 83.4% for buy and hold to 70.7% for the EMA strategy. That is still an extremely severe loss, but it demonstrates that moving to cash after a bearish crossover can reduce exposure during prolonged declines.
The EMA strategy also produced a higher historical Sharpe ratio in this test, meaning that its returns were somewhat better relative to their volatility. However, a Sharpe ratio calculated from one asset and one historical period should not be treated as proof that the same relationship will continue.
Why Can the Win Rate Be Only 50%?
Beginner traders often assume that a successful strategy must win most of its trades. That is incorrect.
In this backtest, only half of the completed trades were profitable. The median trade was slightly negative. Nevertheless, the overall result was strongly positive because several winning positions were much larger than the losing positions.
This is a central characteristic of trend following.
A trend-following system does not need to predict every market move. Instead, it attempts to limit participation in declining markets and remain invested during sustained advances.
The trader must therefore resist two common mistakes:
- abandoning the strategy after a sequence of small losses;
- closing a profitable trade too early simply because it has already generated a large gain.
The second mistake is particularly damaging. A handful of large trends may account for most of the strategy’s long-term performance.
Advantages of the EMA 10/30 Strategy
Clear and Objective Rules
The strategy does not require subjective chart interpretation. At any moment, EMA 10 is either above or below EMA 30.
This makes the system suitable for backtesting, automation and performance monitoring.
Easy to Understand
A beginner can learn the basic rules quickly. No advanced knowledge of market structure, order flow or economic modelling is required.
Effective During Persistent Trends
When a market moves consistently in one direction, the crossover can keep the trader in the position for an extended period.
The October–December 2020 Bitcoin trade is a clear example. The system did not attempt to identify the exact bottom. It entered after upward momentum had already been confirmed and remained invested while the trend continued.
Potential Drawdown Reduction
A long-only crossover strategy can move capital to cash during bearish regimes. In the presented backtest, this reduced the maximum drawdown relative to permanent market exposure.
Applicable to Different Markets and Timeframes
The same logic can be tested on cryptocurrencies, stocks, indices, commodities and foreign-exchange pairs.
However, parameters that work reasonably well on a daily Bitcoin chart may perform poorly on a five-minute stock chart. Every instrument and timeframe must be tested separately.
Limitations and Risks
The Strategy Is Delayed
Moving averages are lagging indicators. A crossover occurs only after the market has already moved.
The strategy will therefore never buy at the exact bottom or sell at the exact top. Attempting to anticipate crossovers usually converts an objective strategy into discretionary guessing.
Sideways Markets Create False Signals
The greatest weakness of an EMA crossover is a range-bound market.
When price repeatedly moves above and below the same area, EMA 10 and EMA 30 can cross several times. The trader may buy shortly before a decline and sell shortly before another recovery.
These repeated losses are known as whipsaws.
Drawdowns Can Still Be Extreme
The backtested maximum drawdown of approximately 70.7% is not conservative risk behaviour. It would be psychologically and financially unacceptable for many traders.
A crossover signal alone is not a complete risk-management system. Position sizing, diversification and maximum portfolio exposure must be considered separately.
Results Depend Heavily on the Tested Period
Bitcoin appreciated enormously between 2015 and 2020. Both the EMA strategy and buy and hold benefited from this structural rise.
The same strategy may produce substantially weaker results in a different asset, a different market cycle or a period dominated by sideways price action.
Costs Can Reduce Short-Timeframe Performance
The presented test used daily candles and only 30 completed trades. Transaction costs were therefore relatively limited.
On an hourly or five-minute chart, the number of signals may increase dramatically. Fees, bid-ask spreads and slippage can transform an apparently profitable strategy into an unprofitable one.
Parameter Optimization Can Create False Confidence
Testing dozens of EMA combinations and selecting the best historical result is a form of overfitting.
For example, choosing EMA 10/30 only because it produced the highest return on one Bitcoin dataset does not demonstrate that it will perform best in the future.
A stronger research process separates data into:
- an in-sample period used to develop the rules;
- an out-of-sample period used to evaluate them;
- and a forward-testing period using paper trading.
How Beginners Can Improve the Basic Strategy
The EMA crossover should be treated as a starting framework rather than a finished trading system.
Possible improvements include:
- trading only when the price is above a long-term EMA, such as EMA 100 or EMA 200;
- requiring a minimum distance between EMA 10 and EMA 30;
- using an Average True Range filter to avoid low-volatility markets;
- requiring above-average trading volume;
- reducing position size when volatility increases;
- applying the strategy to a diversified portfolio rather than one asset;
- testing a protective stop or volatility-based exit;
- avoiding entries when the market is already excessively extended.
Each additional rule must be tested independently. Adding more indicators does not automatically improve a strategy. Complex systems often look impressive historically because they contain enough parameters to fit past noise.
How to Backtest the Strategy Yourself
A reliable backtest should define every rule before looking at the results.
At minimum, specify:
- the market and exchange;
- the candle timeframe;
- the EMA calculation;
- the exact crossover definition;
- the entry execution price;
- the exit execution price;
- fees and slippage;
- position-sizing rules;
- whether profits are compounded;
- how open trades are handled at the end of the test.
You can run this type of backtest using Python, specialist trading software or a strategy-testing platform. Backtests can also be created on a free account at trade-strategy.com, allowing beginners to compare strategy rules without relying solely on visual chart interpretation.
Regardless of the platform, inspect more than the final profit. Review maximum drawdown, number of trades, average trade, profit factor, exposure, losing streaks and performance during different market regimes.
Final Conclusion
The EMA 10/30 crossover strategy is useful because it transforms a vague idea, such as trading with the trend, into clear and testable rules.
The historical BTC/USD backtest presented here generated strong returns, but it did not beat buy and hold in final performance. Its main benefit was reducing drawdown and improving the historical risk-adjusted result.
The strategy worked best during sustained trends and performed worst when the market moved sideways. Its 50% win rate also demonstrates that profitability does not require predicting most trades correctly. A few large trends can generate most of the system’s return.
For a beginner, the correct lesson is not that EMA 10/30 is automatically profitable. The lesson is that a trading idea should be precisely defined, realistically backtested and evaluated across different market environments before real capital is placed at risk.
Past performance, including backtested performance, does not guarantee future results. This material is educational and should not be treated as financial or investment advice.
 2026-08-07
How to Backtest a Bitcoin Strategy
Learn how to backtest a Bitcoin trading strategy using a simple 50 EMA / 200 EMA crossover example. Discover which metrics matter most, common mistakes to avoid, and best practices for evaluating trading performance before risking real capital.
 2026-08-11
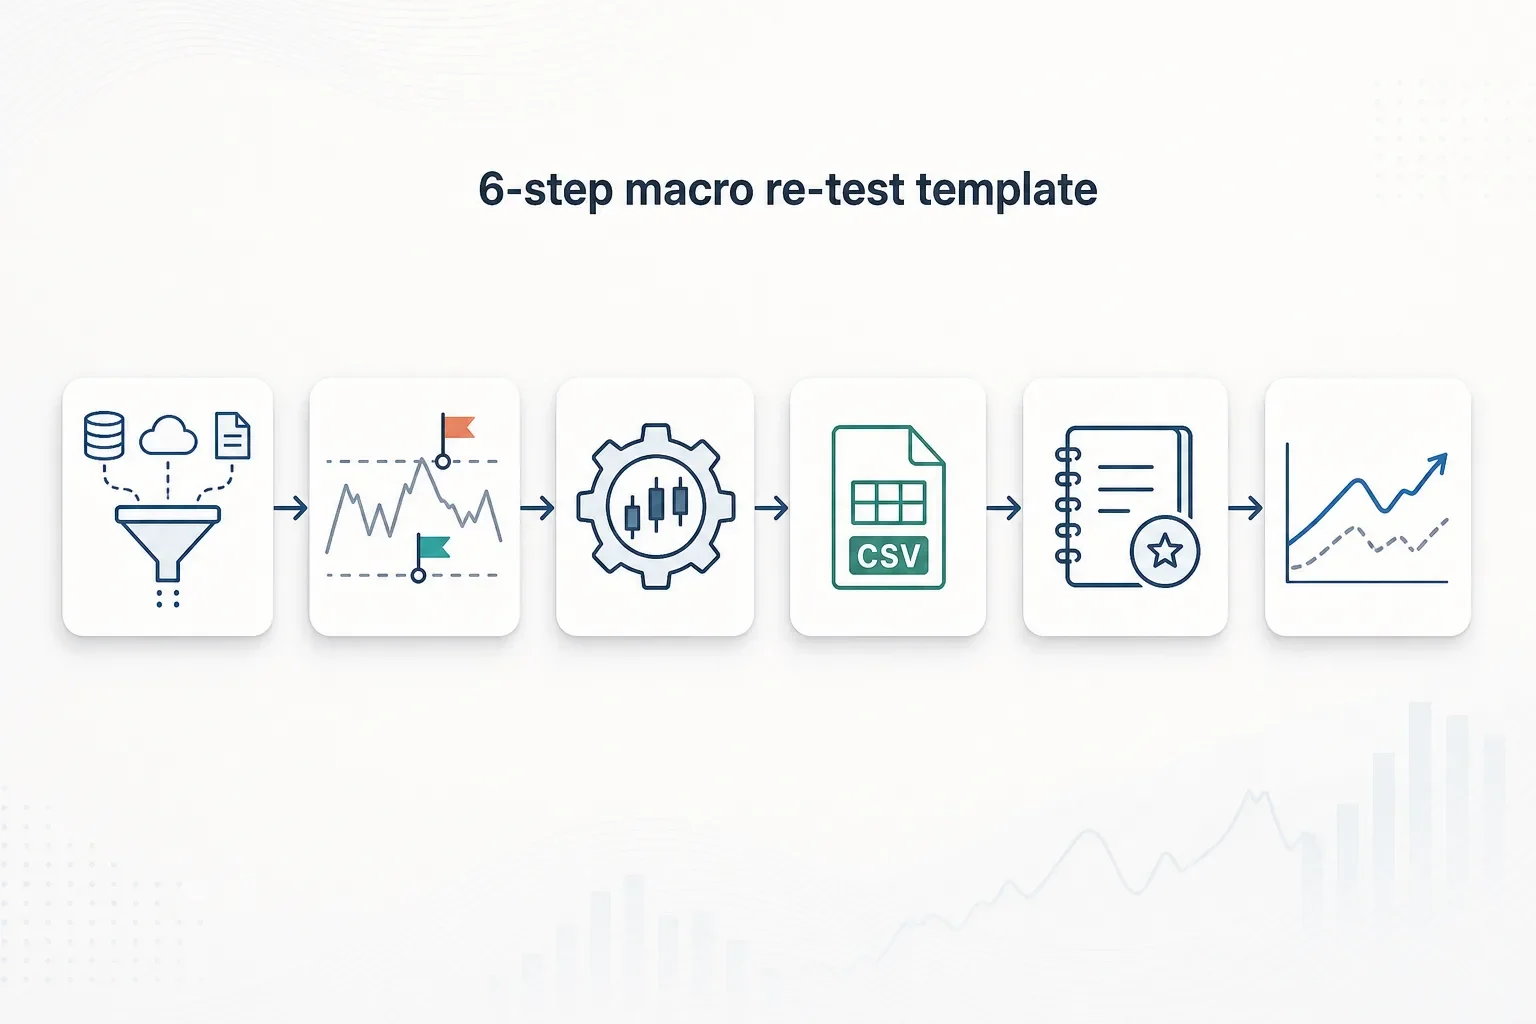
How to Backtest Crypto Strategies Against Rising Rates and Oil Shocks — A Practical Template
A hands-on template for re-testing crypto strategies when rates and oil spike: ingest macro time series, run variant backtests, record results in Trade Strategy, and compare outcomes to adapt sizing rules.
 2026-08-07
BTC Paper Trading Strategy: How to Test Bitcoin Trading Without Risking Real Money
Discover how BTC paper trading works and why every beginner trader should use simulation before risking real money. Learn how to build a Bitcoin paper trading strategy, analyze historical data, evaluate backtest results, and test your ideas using Trade-Strategy.