
How to Backtest Crypto Strategies Against Rising Rates and Oil Shocks — A Practical Template
A hands-on template for re-testing crypto strategies when rates and oil spike: ingest macro time series, run variant backtests, record results in Trade Strategy, and compare outcomes to adapt sizing rules.
# How to Backtest Crypto Strategies Against Rising Rates and Oil Shocks — A Practical Template
Rising oil and higher interest rates can change how Bitcoin behaves versus other risk assets. For quant and discretionary traders, strategy managers and portfolio risk teams, that means a practical re-test of assumptions, exposure and sizing. This guide provides a repeatable workflow you can use today: assemble macro time series, generate overlay signals, run variant backtests in your preferred engine, then document and compare results inside Trade Strategy.
The workflow uses released Trade Strategy features — Strategy Management, Historical Results Journal and Strategy Comparison — to keep assumptions, results and decisions auditable. Trade Strategy plans AI-assisted BTC market analysis and the roadmap includes probabilistic direction suggestions as future decision-support features.
## Why re-test for macro shocks?
Macro moves (for example, higher policy rates or rising oil) can:
- Change correlations and beta exposure for crypto;
- Increase realized volatility and tail risk;
- Reduce the reliability of historical parameter choices (entry thresholds, stops, sizing).
A structured re-test protects you from hidden regime risk: it forces clear assumptions, repeatable scenarios and documented outcomes so you can adapt sizing and limits with evidence.
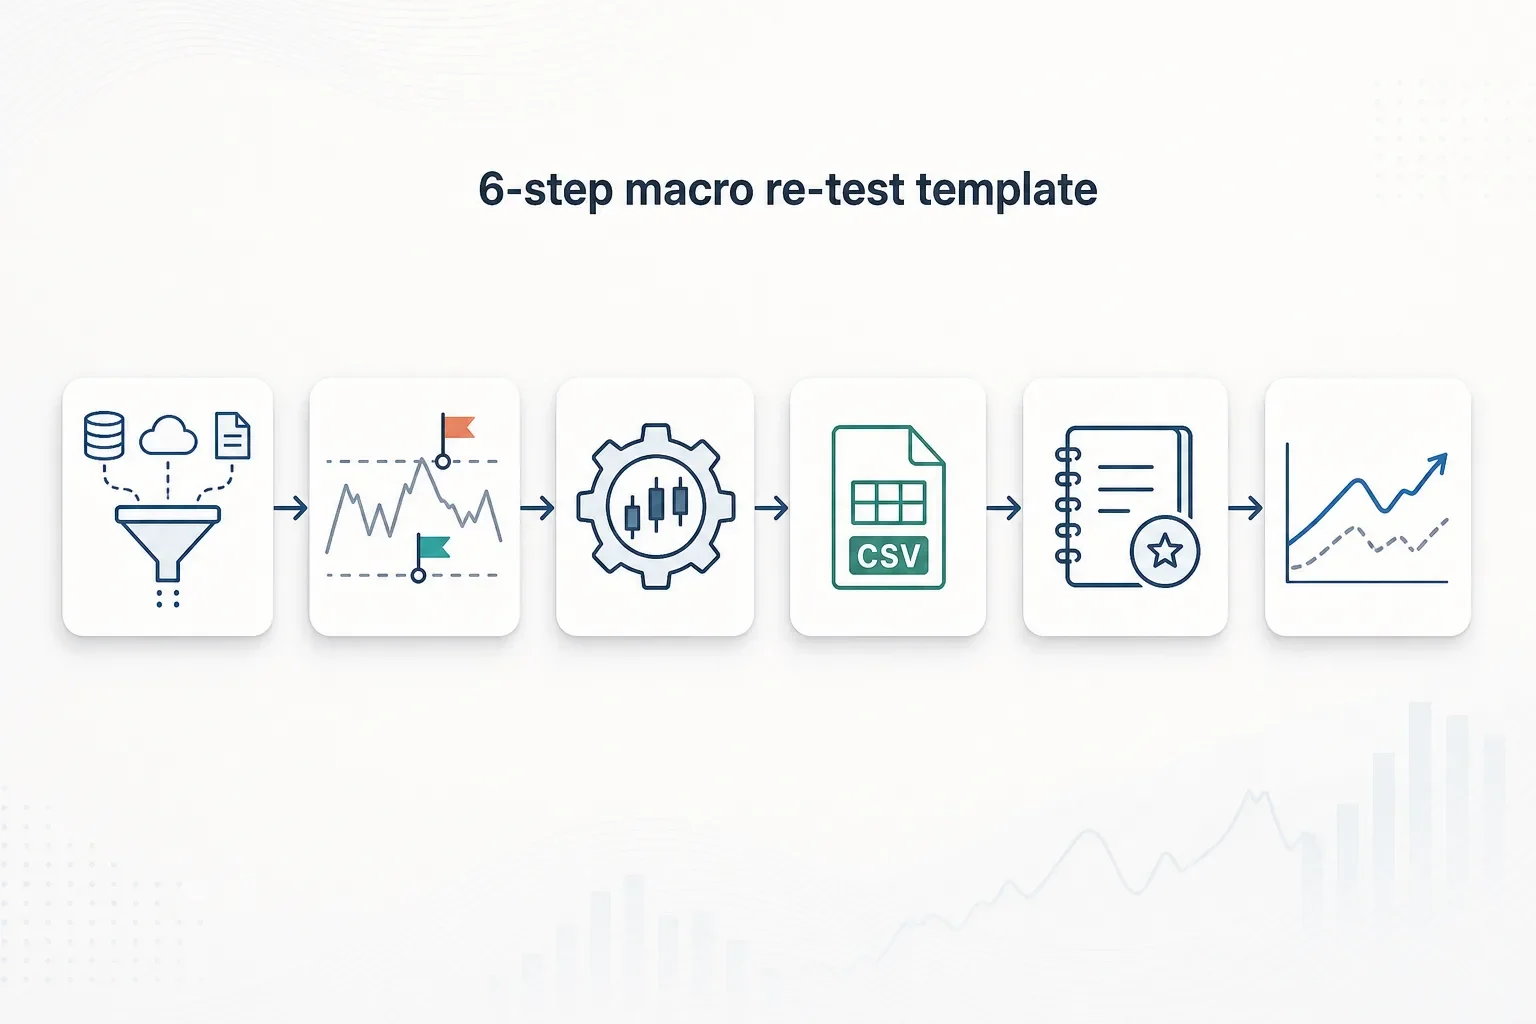
## Overview: the 6-step template
1. Acquire macro time series and define shock windows.
2. Build macro overlay signals (CSV or time series).
3. Run backtests in your execution/backtest environment (Python, backtest platform, etc.).
4. Export per-trade and per-period results to CSV.
5. Import and record results in Trade Strategy's Historical Results Journal and document variants in Strategy Management.
6. Use Strategy Comparison to evaluate before/after performance and drive sizing changes.
Below we expand each step with practical examples and a sample resizing checklist.
## Step 1 — Acquire macro data and define shock windows
Sources: public feeds (central bank rate data, Treasury yields, oil spot prices, major news timestamps) or your paid vendor. Keep raw time series and an archival copy.
Practical choices:
- Frequency: daily is usually sufficient for regime overlays; use higher frequency if your strategy trades intraday.
- Windows: define historical “shock windows” (periods when rates rose materially, oil spikes occurred, or important regulatory events happened). These will be used to tag results.
Example: create a table of shock windows with start_date, end_date, trigger (e.g., "10y yield > X for N days", "WTI jump > Y% in 3 days").
## Step 2 — Build macro overlay signals
Turn raw series into discrete overlay flags or continuous factors. Common overlays:
- Binary flag: HighRate = 1 when 10y yield is above the threshold for N days.
- Shock flag: OilShock = 1 during identified oil spike windows.
- Continuous factor: RateLevel = normalized yield level (0–1).
Save these overlays to CSV with a timestamp column and one column per overlay. This CSV will be used to tag both backtest runs and historical trade results.
## Step 3 — Run backtests (outside Trade Strategy)
Trade Strategy is used to document and compare strategies; it does not execute trades or run live backtests. Use your preferred backtest engine (Python, Backtrader, proprietary platform) to:
- Run a base strategy (no overlay);
- Run variants with overlays applied (e.g., reduced leverage when HighRate==1, or pause new entries during OilShock);
- Keep all configuration metadata (parameter values, data sources, date range) with each run.
Export per-trade logs and summary statistics to CSV: include trade timestamps, P&L, position size, realized volatility, and any overlay flags active for that trade.
## Step 4 — Import and record results in Historical Results Journal
For auditability and future comparison, import the exported CSVs or manually record summary outcomes in Trade Strategy's Historical Results Journal. Recommended fields to store:
- Strategy name and variant tag (e.g., "Momentum – Base", "Momentum – HighRateSizing");
- Run date and data range;
- Per-trade fields (date, entry, exit, P&L, size, overlay flags);
- Aggregate stats (net P&L, max drawdown, a Sharpe-like ratio you compute, realized volatility, win rate);
- Notes: input assumptions, data sources, and known limitations.
Documenting assumptions in Strategy Management is essential: record the rules that created each variant (resize rules, thresholds) so comparisons remain clear.
## Step 5 — Create strategy variants in Strategy Management
In Strategy Management create a clear hierarchy or naming convention for variants. Good practice:
- Link each variant to the same base strategy and list the rule differences explicitly.
- Include version notes: who ran the test, when, and which datasets were used.
Example naming convention:
- BTC-Mom | Base
- BTC-Mom | HighRate - Size 50%
- BTC-Mom | OilShock - Flat
This makes it simple to filter history and compare using Strategy Comparison.
## Step 6 — Use Strategy Comparison to evaluate pre/post shock performance
Use Strategy Comparison to filter recorded historical runs and compare key outcomes. Key things to evaluate:
- Drawdown behavior during shock windows (duration and depth);
- Change in realized volatility and average position size;
- Return per unit risk (e.g., return / volatility) before and during shock windows;
- Frequency of stop-outs or forced deleveraging events.
Focus on actionable metrics: if a variant with reduced sizing during HighRate windows has materially shallower drawdowns with acceptable performance loss, it may be a superior risk-adjusted choice.
## Practical resizing checklist (sample)
- Trigger definition: what concrete rule flips sizing (e.g., 10y yield > threshold for 3 consecutive sessions).
- Sizing tiers: Full / 75% / 50% / Flat.
- Stop adjustments: widen or tighten stops based on realized vol band.
- Re-entry rules: require normalization for N days before restoring size.
- Correlation guardrails: reduce exposure if BTC–equity correlation rises above a threshold for M days.
- Documentation: log every sizing change in Historical Results Journal with reasons and timestamp.
Use the downloadable checklist on our blog to adapt these items to your risk framework.
## Example scenario (concise)
A momentum strategy shows deeper drawdowns during periods when both oil spikes and yields rise. You test two variants:
- Variant A: reduce position size by 50% while HighRate==1.
- Variant B: pause new entries during OilShock windows.
After uploading results and comparing, Variant A reduced drawdown depth with modest return drag; Variant B reduced turnover and avoided several stop-outs. Document both outcomes and choose rules consistent with your objectives.
## Notes on roadmap
Trade Strategy plans AI-assisted BTC market analysis. The roadmap also includes probabilistic direction suggestions intended as decision support. These are planned, upcoming features and are presented as decision-support tools rather than certainty.
## Conclusion
Macro shocks demand a structured, repeatable workflow: gather macro data, convert to overlays, test variants externally, then record and compare outcomes inside Trade Strategy. That discipline preserves institutional memory, improves reproducibility and helps you make sizing decisions with evidence rather than gut feeling.
Downloadable assets — a macro-overlay CSV template, a sample resizing checklist and annotated screenshots showing how to document variants and results in Trade Strategy — are available on our blog.
Call to action: Read the step-by-step guide and download the macro-overlay template: https://trade-strategy.com/blog
 2026-08-11
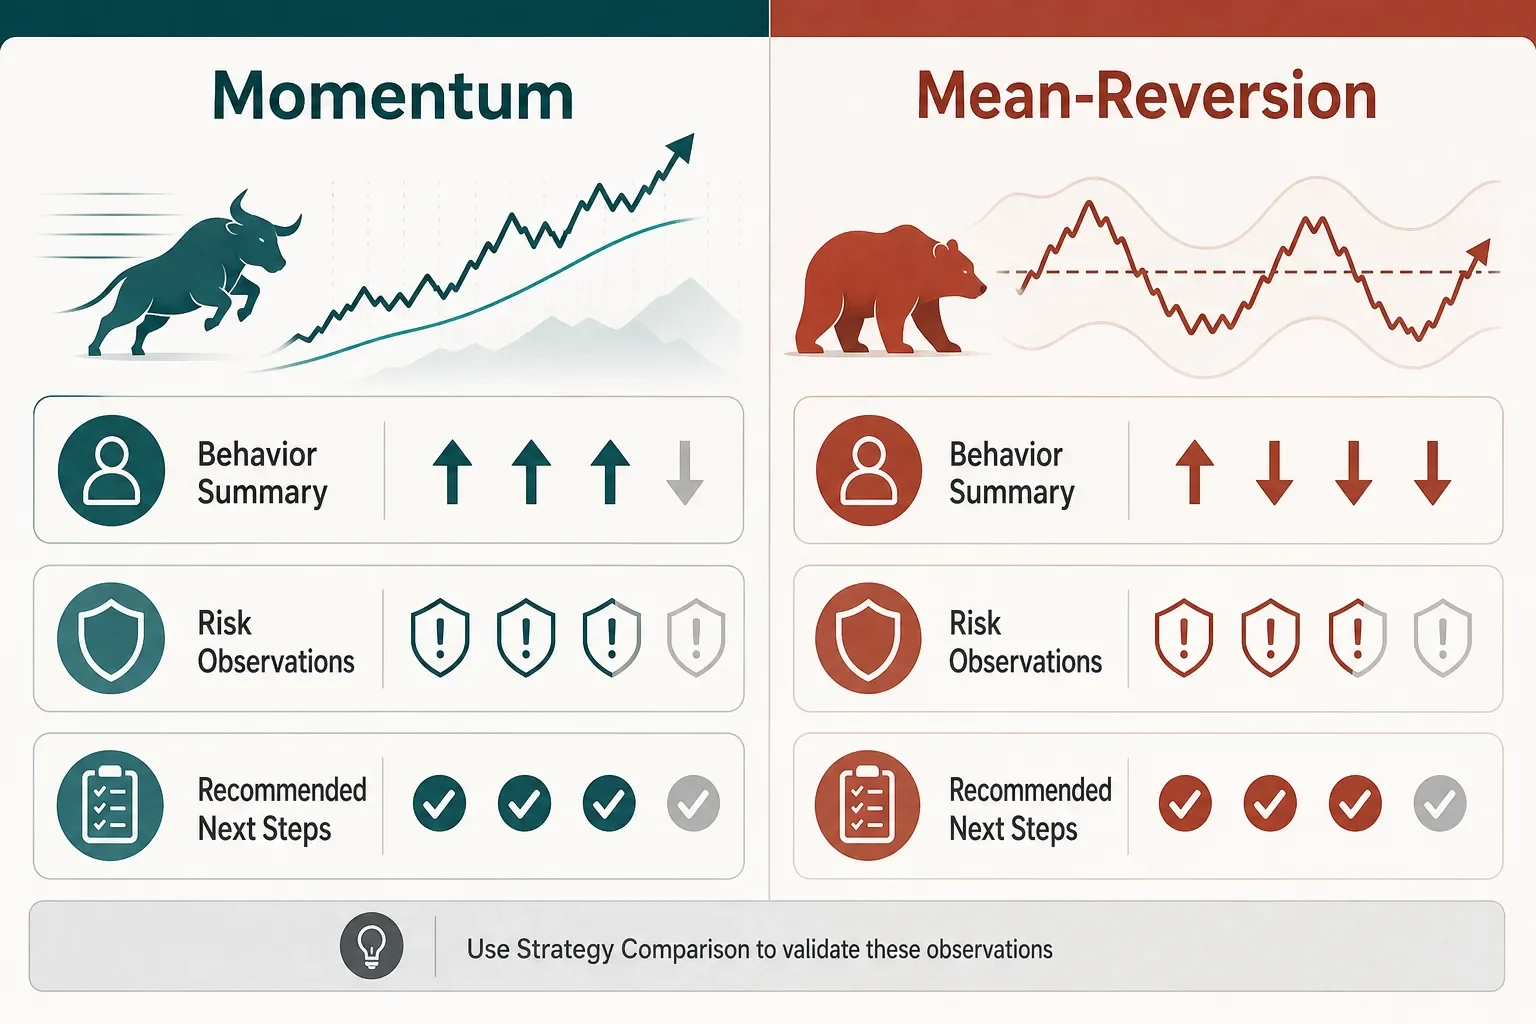
When Markets Decouple: A Trader’s Checklist for Post‑Event Strategy Reviews
A step‑by‑step playbook for post‑event reviews: capture hypotheses, tag trades by catalyst, log outcomes, and use Strategy Comparison to see what held up during the Korea chip crash vs. Bitcoin rally.
 2026-08-11
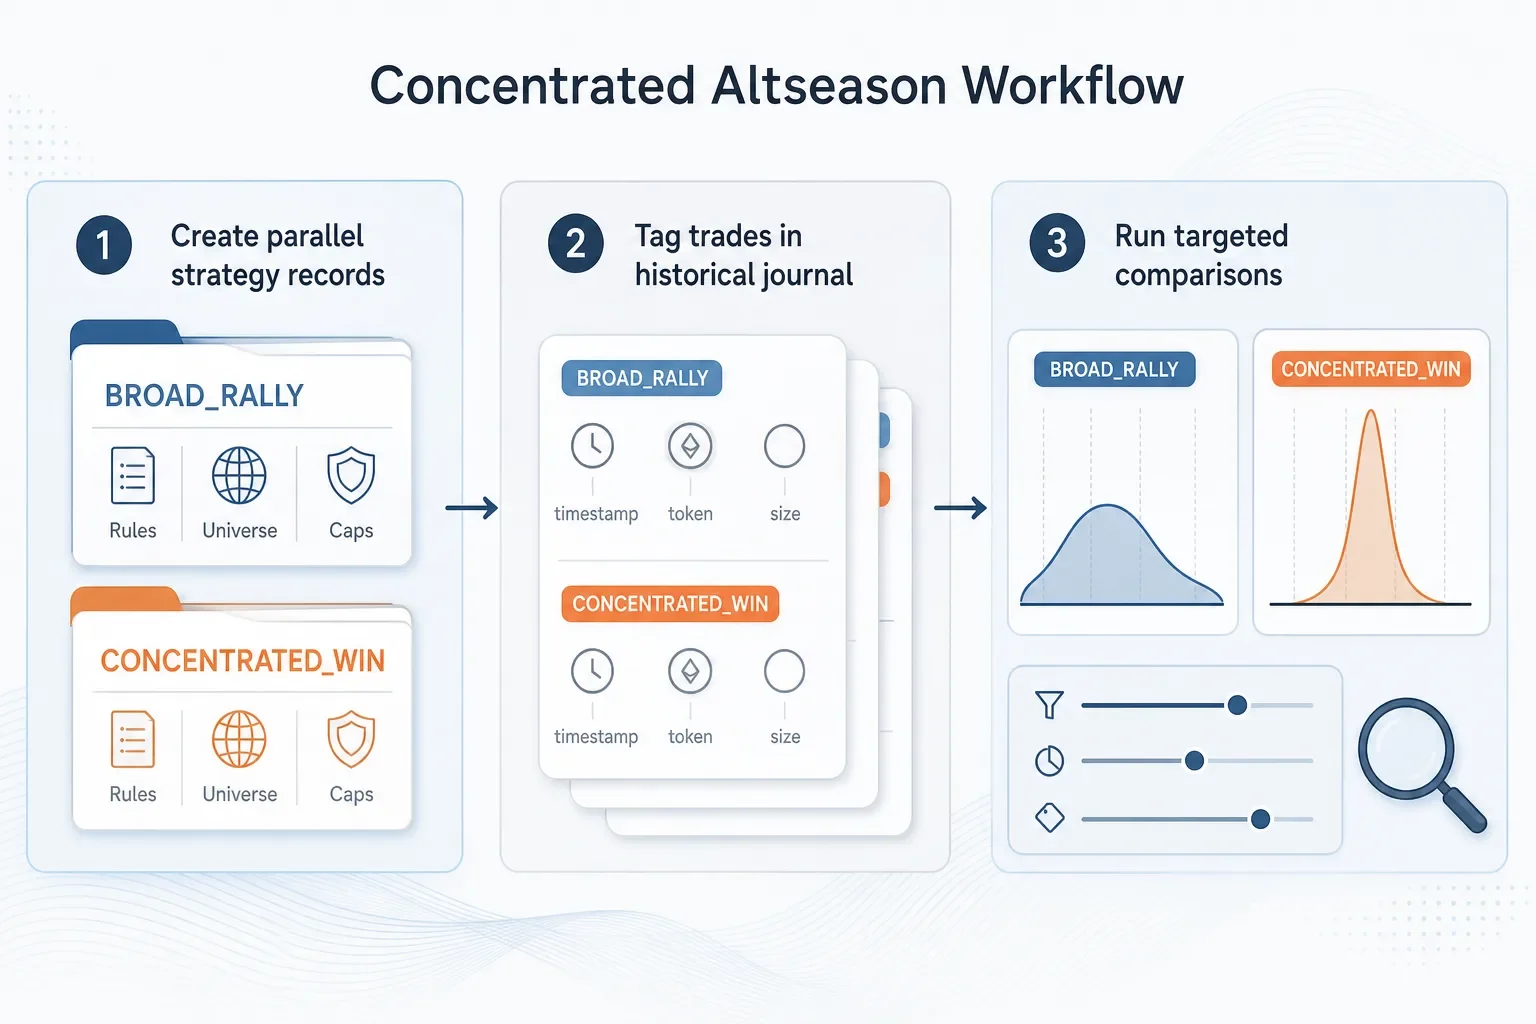
How to Adapt Your Strategies for a More Concentrated Altseason
Step-by-step workflow to adapt trading strategies for a concentrated altseason: create regime-specific strategy records, tag outcomes in a historical journal, compare results across token subsets, and apply concentration-aware sizing and monitoring.
 2026-08-11
Miner Stress Testing for BTC Strategies: A Reproducible Case Study & Template
A forensic primer on turning a ~14% Bitcoin difficulty drop into testable strategy rules. Learn which miner metrics to track, how to encode stress variants (sizing, stops, filters) and how to record reproducible case studies in Trade Strategy.