
How to run an event-driven post‑mortem for your BTC strategy (step‑by‑step)
A step‑by‑step workflow for BTC event‑driven post‑mortems: record rules, log trades, compare pre/event/post windows using Trade Strategy to identify rule breakpoints and create testable updates.

# How to run an event-driven post‑mortem for your BTC strategy (step‑by‑step)
When oil spikes, yields surge and BTC dumps, ad‑hoc reactions cost capital and clarity. A repeatable post‑mortem captures what mattered, separates noise from actionable lessons, and gives you a documented path to update rules. This guide walks through a step‑by‑step workflow for event‑driven reviews, using Trade Strategy features—Strategy Management, Historical Results Journal and Strategy Comparison—to record strategy rules, log outcomes and compare performance across volatile episodes.
## When to run an event‑driven review
Run a focused post‑mortem whenever a macro or geopolitical shock meaningfully changes market behavior for your timeframes. Typical triggers:
- Cross‑asset moves (sharp oil or yields moves coinciding with BTC volatility).
- Large intraday BTC moves relative to your average trade size or stop distances.
- Liquidity or spread widening that affected fills.
- A sequence of losing trades clustered around the same external event.
The trigger is not a fixed percentage — use what materially affects your strategy performance (e.g., fills, slippage, trade frequency, risk limits).
## Step 1 — Record rules and assumptions (Strategy Management)
Start by capturing the precise rules and the assumptions you relied on before the event. Use your Strategy Management space to create or update a strategy snapshot.
What to record:
- Strategy name and purpose (e.g., “Short‑term breakout for BTC 1H”).
- Entry and exit rules with exact conditions and timeframe references.
- Position sizing and risk controls (max position, stop rules, allocation rules).
- Market assumptions (correlation assumptions, liquidity expectations, macro dependencies).
- Pre‑event guardrails (volatility filters, trading hours, news blackout rules).
Example entry:
- Name: Momentum Breakout — 1H
- Entry: 1H close above 20‑EMA with volume confirmation
- Stop: 1.5× ATR(14) below entry
- Assumption: BTC correlation with equities is muted; liquidity is available in 1H windows
Capturing these explicitly makes it easier to see where reality diverged from assumptions during the shock.
## Step 2 — Log trades and outcomes in the Historical Results Journal
Next, log the trades and context. The Historical Results Journal is where objective trade records meet subjective notes.
Key fields to log:
- Trade timestamp, direction, size, entry/exit prices and realised P&L.
- Execution details: fills, slippage, partial fills.
- Market context: BTC price action, notable cross‑asset moves (oil, yields, equities), volatility regime.
- Reasoning: what signal triggered the trade and whether the decision followed your rules.
- Tags: event label (e.g., IranConflict2026), volatility regime, strategy name.
- Screenshots and chart snippets when available.
Example journal note:
- Trade: Long, 2026‑07‑21 09:12 UTC, entry 66,200, exit 64,900, −1.9% realised
- Notes: Entered on 1H breakout signal. Oil spiked intraday; US yields jumped. Wider spreads and slippage on exit.
- Tag: IranConflict2026, HighVol
Logging both quantitative and qualitative observations prevents hindsight bias and clarifies whether losses were rule violations or regime‑related failures.
## Step 3 — Compare periods with Strategy Comparison
Use Strategy Comparison to put the event into context. Compare the same strategy across at least three windows:
- Baseline period (pre‑event performance under expected conditions).
- Event window (the shock and immediate aftermath).
- Recovery/post‑event window.
What to compare:
- Win rate and average return per trade.
- Average trade duration and time‑of‑day sensitivity.
- Drawdown behaviour and frequency of stop‑outs.
- Execution quality (average slippage, partial fills).
How to interpret results:
- If win rate and average return collapse only during the event window, investigate regime sensitivity — did a correlation breakdown or liquidity shock make your edge invalid?
- If execution metrics (slippage, fills) deteriorated, consider rules that account for spread and liquidity (wider stops, reduced size, avoid certain venues/hours).
- If trade timing shifted (longer durations, more whipsaws), your timeframe assumptions may need recalibration.
Practical example: a momentum strategy that historically performs well during quiet regimes shows normal win rate in baseline, heavy drawdowns and higher slippage in the event window. The comparison suggests the primary issue was liquidity and correlation shock, not the signal itself.
## Common failure modes to watch for
- Correlation breakdown: BTC starts moving with an asset your strategy assumed was uncorrelated (e.g., sharp yield moves). That invalidates risk models and sizing.
- Rule fragility: tight stops that worked in low volatility get hit repeatedly when ATR expands.
- Execution slippage: spreads widen and partial fills undermine position sizing and exits.
- Latency and time‑of‑day effects: news windows create microstructure noise your signal wasn't designed for.
Document which failure mode applied — this helps prioritize fixes.
## Update rules and set experiments
A post‑mortem should end with concrete, testable actions recorded in Strategy Management and reflected in future journal entries:
- Add a volatility filter (e.g., skip new entries if 24H realized vol > X) and log the rationale.
- Introduce event tags and disable certain strategies during predefined event types unless explicitly approved.
- Adjust position sizing when cross‑asset correlations exceed thresholds.
- Create a paper‑trade or small live experiment to validate a tweak before rolling it into full size.
Record each change as a new strategy revision with a clear hypothesis and metrics to track in the Historical Results Journal.
## Quick checklist (useable immediately)
- Capture current strategy rules and assumptions in Strategy Management.
- Tag the event in every relevant journal entry (date, event label, volatility tag).
- Log execution details and subjective notes for every affected trade.
- Run a Strategy Comparison across pre/event/post windows.
- Identify failure mode(s) and document at least one testable rule change.
- Schedule a follow‑up review after the test window.
You can download a printable checklist and a template for journal entries from our blog at https://trade-strategy.com/blog.
## Conclusion
Event‑driven post‑mortems turn reactive frustration into documented learning. By consistently capturing rules in Strategy Management, logging detailed outcomes in the Historical Results Journal, and running cross‑period Strategy Comparison, you create a repeatable decision‑support loop. Record hypotheses, run controlled tests, and let documented evidence guide updates rather than emotion.
Read the workflow and download the checklist at https://trade-strategy.com/blog
 2026-08-07
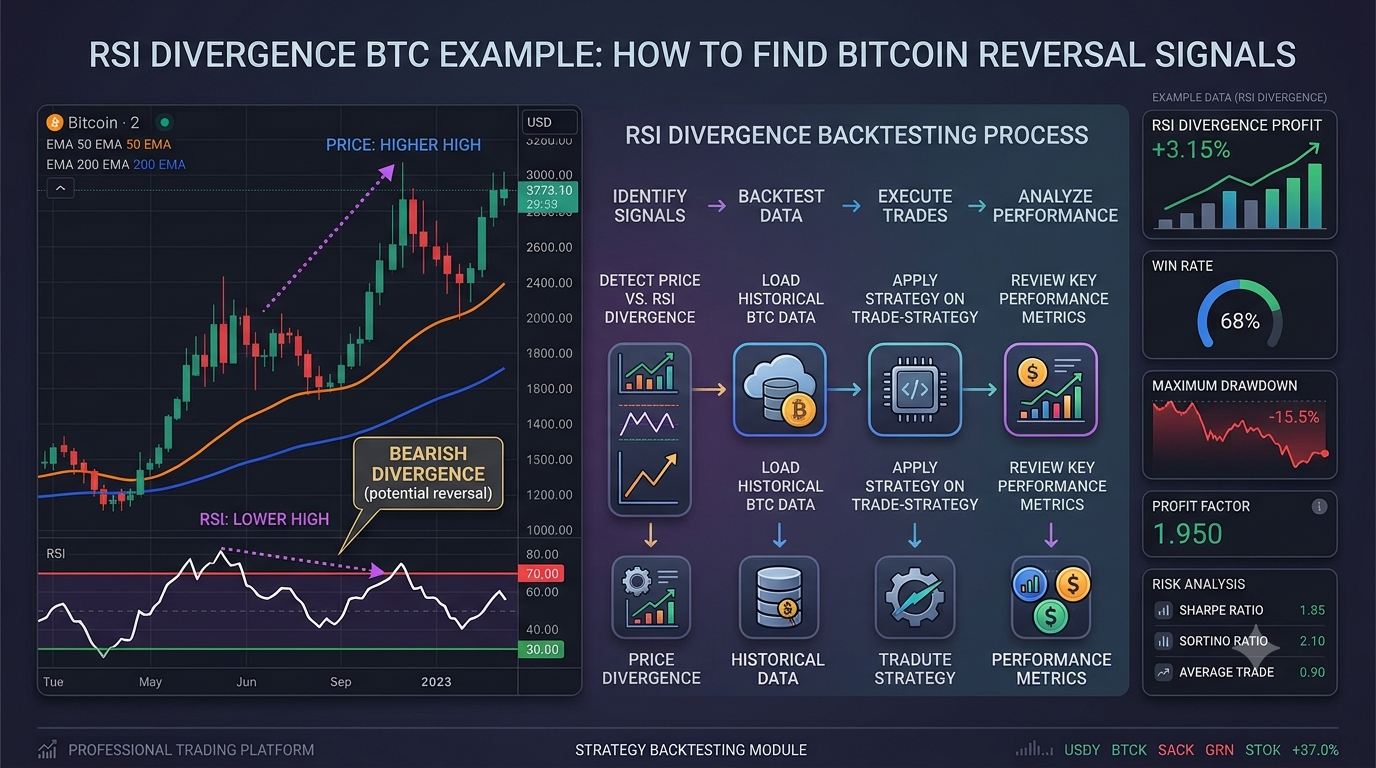
BTC Paper Trading Strategy: How to Test Bitcoin Trading Without Risking Real Money
Discover how BTC paper trading works and why every beginner trader should use simulation before risking real money. Learn how to build a Bitcoin paper trading strategy, analyze historical data, evaluate backtest results, and test your ideas using Trade-Strategy.
 2026-08-07
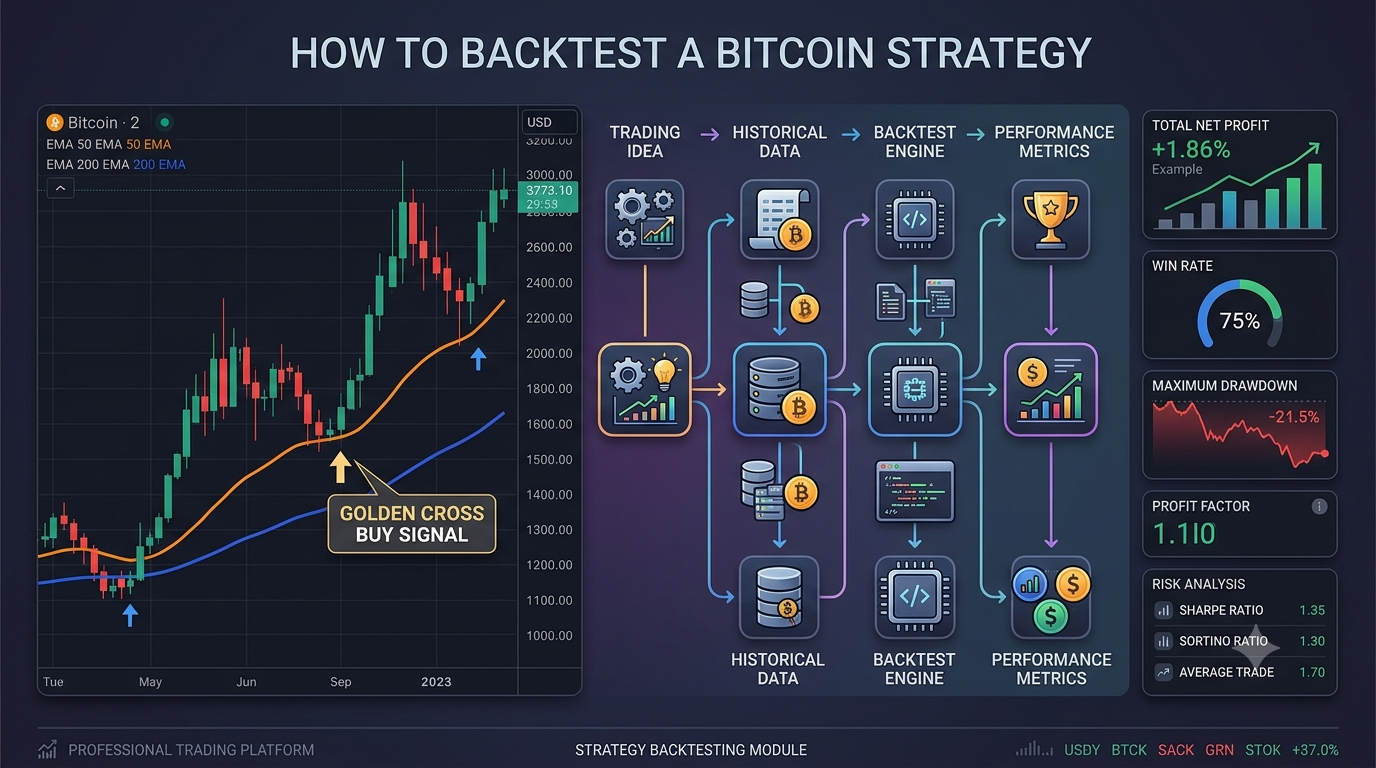
How to Backtest a Bitcoin Strategy
Learn how to backtest a Bitcoin trading strategy using a simple 50 EMA / 200 EMA crossover example. Discover which metrics matter most, common mistakes to avoid, and best practices for evaluating trading performance before risking real capital.
 2026-08-01
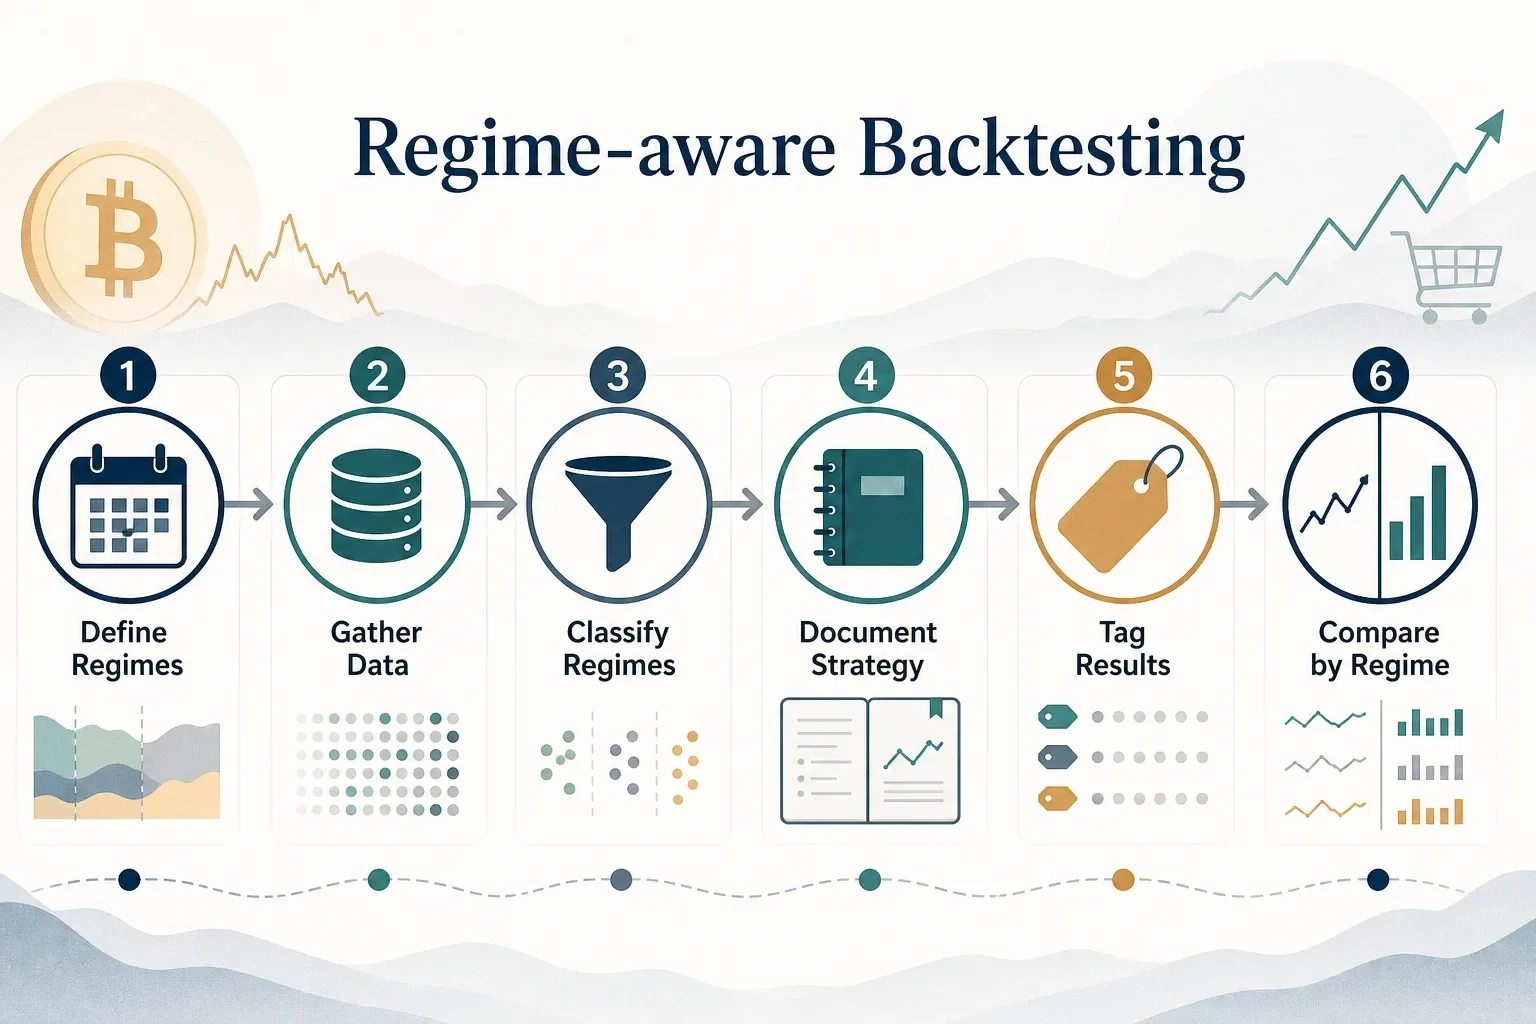
How to Backtest Bitcoin Strategies Across Inflation and Commodity Regimes
A step‑by‑step workflow to backtest Bitcoin strategies across inflation and commodity regimes using Trade Strategy's strategy management, historical results journal and strategy comparison. Includes practical examples and a reproducible checklist.