
How to Backtest Bitcoin Strategies Across Inflation and Commodity Regimes
A step‑by‑step workflow to backtest Bitcoin strategies across inflation and commodity regimes using Trade Strategy's strategy management, historical results journal and strategy comparison. Includes practical examples and a reproducible checklist.
# How to Backtest Bitcoin Strategies Across Inflation and Commodity Regimes
Bitcoin's pullback as oil topped $85 shows how quickly macro shocks can flip correlations and stress trading rules. This guide provides a step‑by‑step workflow to build regime‑aware backtests, using practical datasets and Trade Strategy's released tools: strategy management, the historical results journal and strategy comparison. You'll finish with a reproducible checklist and examples of what to watch during commodity‑ or inflation‑driven episodes.
## Why regime-aware backtests matter
Standard backtests that treat history as a single homogeneous period can miss structural shifts. Inflation surprises, commodity spikes (oil, gas, metals) and major policy comments can change volatility, liquidity and cross‑asset correlations. The goal of regime‑aware testing is not to predict the next shock, but to understand how a strategy historically performed across different macro environments so you can design rules, position sizing and risk limits that are more robust to those shifts.
## Overview of the workflow
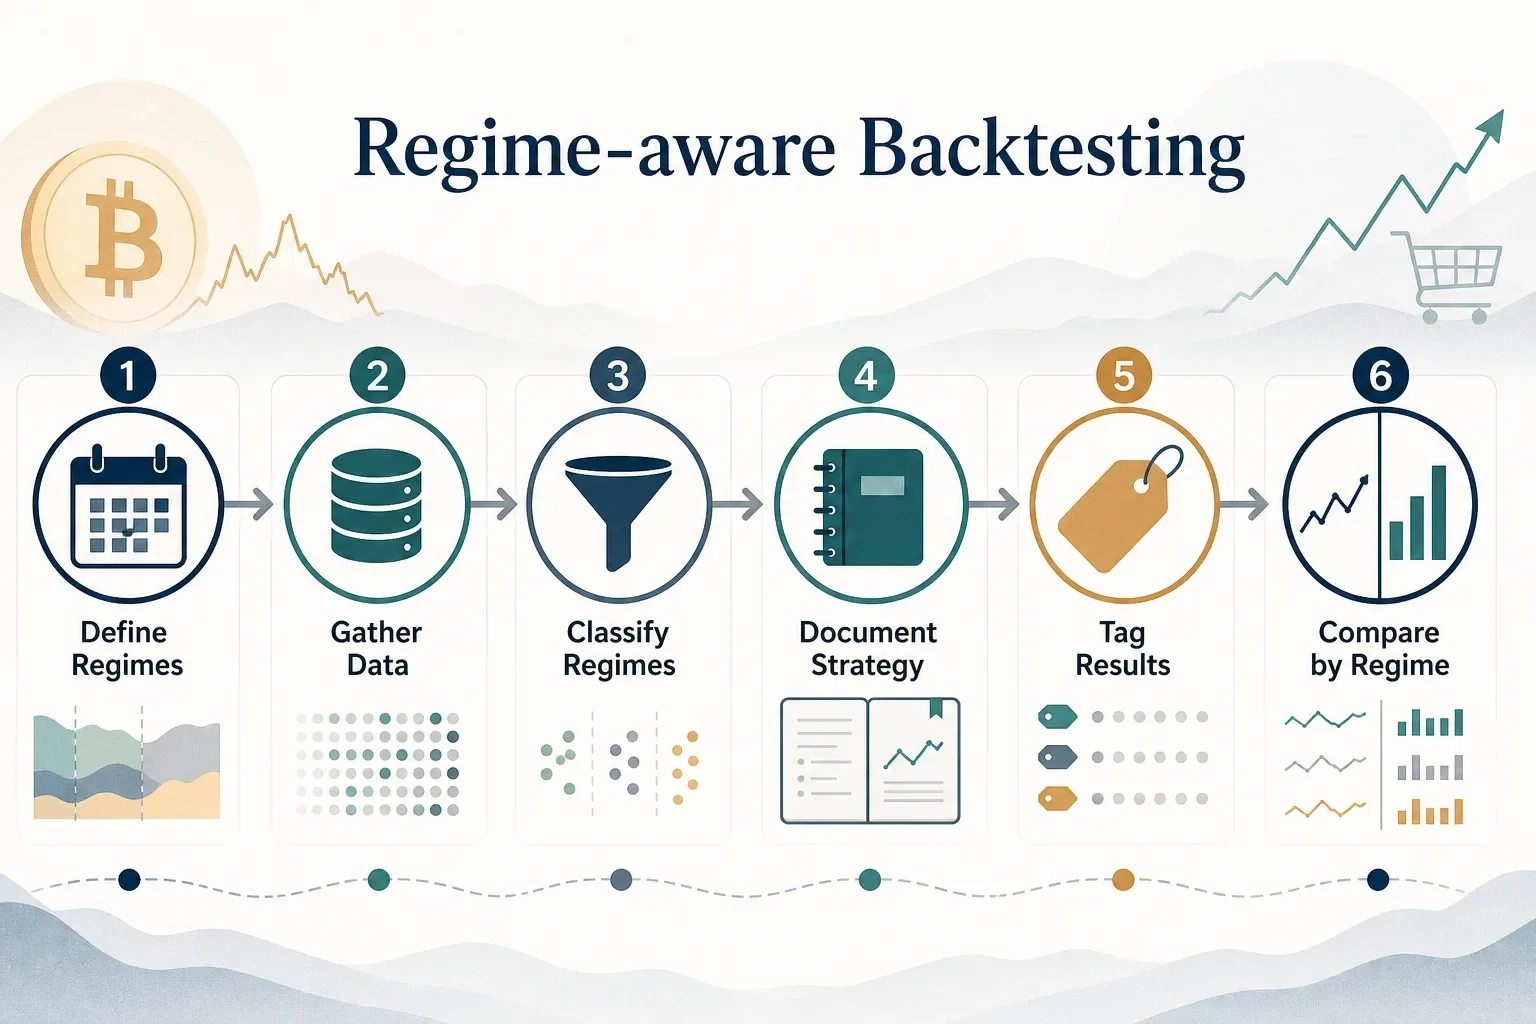
1. Define the macro regimes you want to test (inflation surprise, oil spike, neutral).
2. Gather and align datasets (BTC price history, commodity prices, CPI release dates, Fed event calendar).
3. Implement regime classification (thresholds, event windows, or indicator-based labels).
4. Document your strategy rules and assumptions in Trade Strategy's strategy management.
5. Tag trades or time periods in the historical results journal with regime labels.
6. Use strategy comparison to decompose performance and metrics by regime.
7. Interpret results and iterate on rules or risk sizing.
## Step 1 — Define regimes practically
Choose definitions that are simple, repeatable and defensible. Examples:
- Inflation Surprise: CPI print > consensus by X basis points. Classify day‑of and N days after as "inflation surprise".
- Oil Spike: Brent or WTI closes above a defined threshold (e.g., $85) or daily change > Y%. Label immediate and short windows after spike.
- Calm/Neutral: Periods outside any flagged event windows.
Keep definitions explicit so you can reproduce the test and explain assumptions in your strategy documentation.
## Step 2 — Gather and align datasets
You need a reliable BTC series plus the macro time series or event markers you defined. Sources can include exchange price data for BTC, publicly published CPI release dates and commodity price feeds for oil. Align timestamps and time zones and decide whether your backtest uses daily, hourly or intraday bars. Record your data sources and any cleaning steps in Trade Strategy's strategy documentation.
## Step 3 — Classify regimes
There are two common approaches:
- Threshold/event tagging: Create a list of event dates (e.g., CPI prints, Fed minutes) and define pre/post windows. Or set a price threshold for oil and label any day the price exceeded it as a spike.
- Indicator-driven regimes: Use moving averages, volatility regime indicators, or rolling correlation to define high/low inflation sensitivity periods.
Either approach should produce a simple label for each bar or trade: e.g., Inflation=High, Oil=Spike, Regime=Neutral.
## Step 4 — Document strategy rules and assumptions in Trade Strategy
Before running any analysis, formalize your hypothesis and trading rule set in Trade Strategy's strategy management. Include:
- Entry and exit rules
- Position sizing logic and risk limits
- Assumptions about liquidity and slippage
- The regime definitions you will test
Well‑documented assumptions make later decomposition and post‑mortems clearer.
## Step 5 — Tag trades or time periods in the historical results journal
Trade Strategy's historical results journal is where you record past trades and outcomes. For regime testing you can:
- Manually tag individual trades with regime labels (if trades are sparse or manually executed).
- Tag entire time slices (blocks of bars) with a regime and mark any trades that fall in those slices.
Practical tip: create a consistent naming convention for tags, e.g., "Inflation_High_2026Q2" or "Oil_Spike_Jul2026". This makes filtering in strategy comparison straightforward.
## Step 6 — Use strategy comparison to decompose performance by regime
Once trades and time periods are tagged, use Trade Strategy's strategy comparison to filter returns by tags and measure performance across regimes. Compare the same strategy (or multiple strategies) on these questions:
- How do returns and maximum drawdowns differ by regime?
- Does volatility, average trade duration or win rate change meaningfully?
- Are risk‑adjusted metrics (e.g., return per unit volatility) consistent across regimes?
Example analyses:
- Filter to "Oil_Spike" tags and compare cumulative return vs the neutral period.
- Filter to "Inflation_High" windows and inspect changes in trade frequency and average loss size.
These comparisons surface whether a strategy degrades during commodity‑ or inflation‑driven episodes and where risk exposure concentrates.
## Practical examples
Example A — Momentum strategy diagnosis
- Hypothesis: Time series momentum on daily BTC works most of the time but may fail when inflation surprises increase volatility.
- Process: Tag CPI release windows as "Inflation_High" and compare win rate and average loss size during those windows versus neutral windows.
- Possible outcome: You might find higher volatility and wider drawdowns during inflation windows, suggesting a smaller risk per trade or a volatility‑adjusted entry would help. (This is an interpretation step — derive conclusions from your own tagged results.)
Example B — Commodity shock overlay
- Hypothesis: Sudden oil spikes increase cross‑asset risk and pull liquidity from crypto markets.
- Process: Tag oil spike days and short aftermath windows; review trade slippage, time-to-exit and position fills recorded in your journal.
- Possible actions: Add event filters to avoid initiating large positions in the immediate aftermath of major commodity moves, or tighten stops for that regime.
## What to watch during commodity- or inflation-driven episodes
- Volatility spikes: monitor realized volatility and widen/narrow position sizes accordingly.
- Liquidity and spread widening: record slippage in the historical journal and treat it as a modeled cost in future tests.
- Cross‑asset correlation shifts: note whether BTC moves with oil, equities, or rates recently; these shifts can alter hedging effectiveness.
- Event clustering: multiple macro events in a short window can amplify effects — tag clustered events separately.
## Roadmap note (product vision)
Trade Strategy plans AI‑assisted BTC market analysis and probabilistic direction suggestions as part of the product roadmap. These are upcoming decision‑support items on the roadmap and are not current platform capabilities. The workflow above uses released features only: strategy management, the historical results journal and strategy comparison.
## Reproducible checklist
- Define regime labels and explicit thresholds or event windows.
- Collect BTC prices, commodity prices and official event dates; record sources.
- Document strategy rules and regime definitions in Trade Strategy's strategy management.
- Tag trades or time windows in the historical results journal with consistent labels.
- Use strategy comparison to filter by tags and compare returns, drawdown, volatility and trade‑level metrics.
- Review slippage and liquidity notes; iterate rules or risk sizing for stressed regimes.
- Keep a dated post‑mortem for any real drawdown attributed to macro events.
## Conclusion
Regime‑aware backtesting converts a vague concern about macro risk into measurable insights. By explicitly labeling inflation surprises and commodity shocks, documenting assumptions in Trade Strategy, and decomposing results with strategy comparison, you can see which rules hold and where risk concentrates. Use the checklist above to make the process repeatable and keep a conservative, evidence‑based approach when adapting rules for stressed regimes.
Read the full walkthrough and download the regime‑testing checklist on our blog: https://trade-strategy.com/blog
 2026-08-11
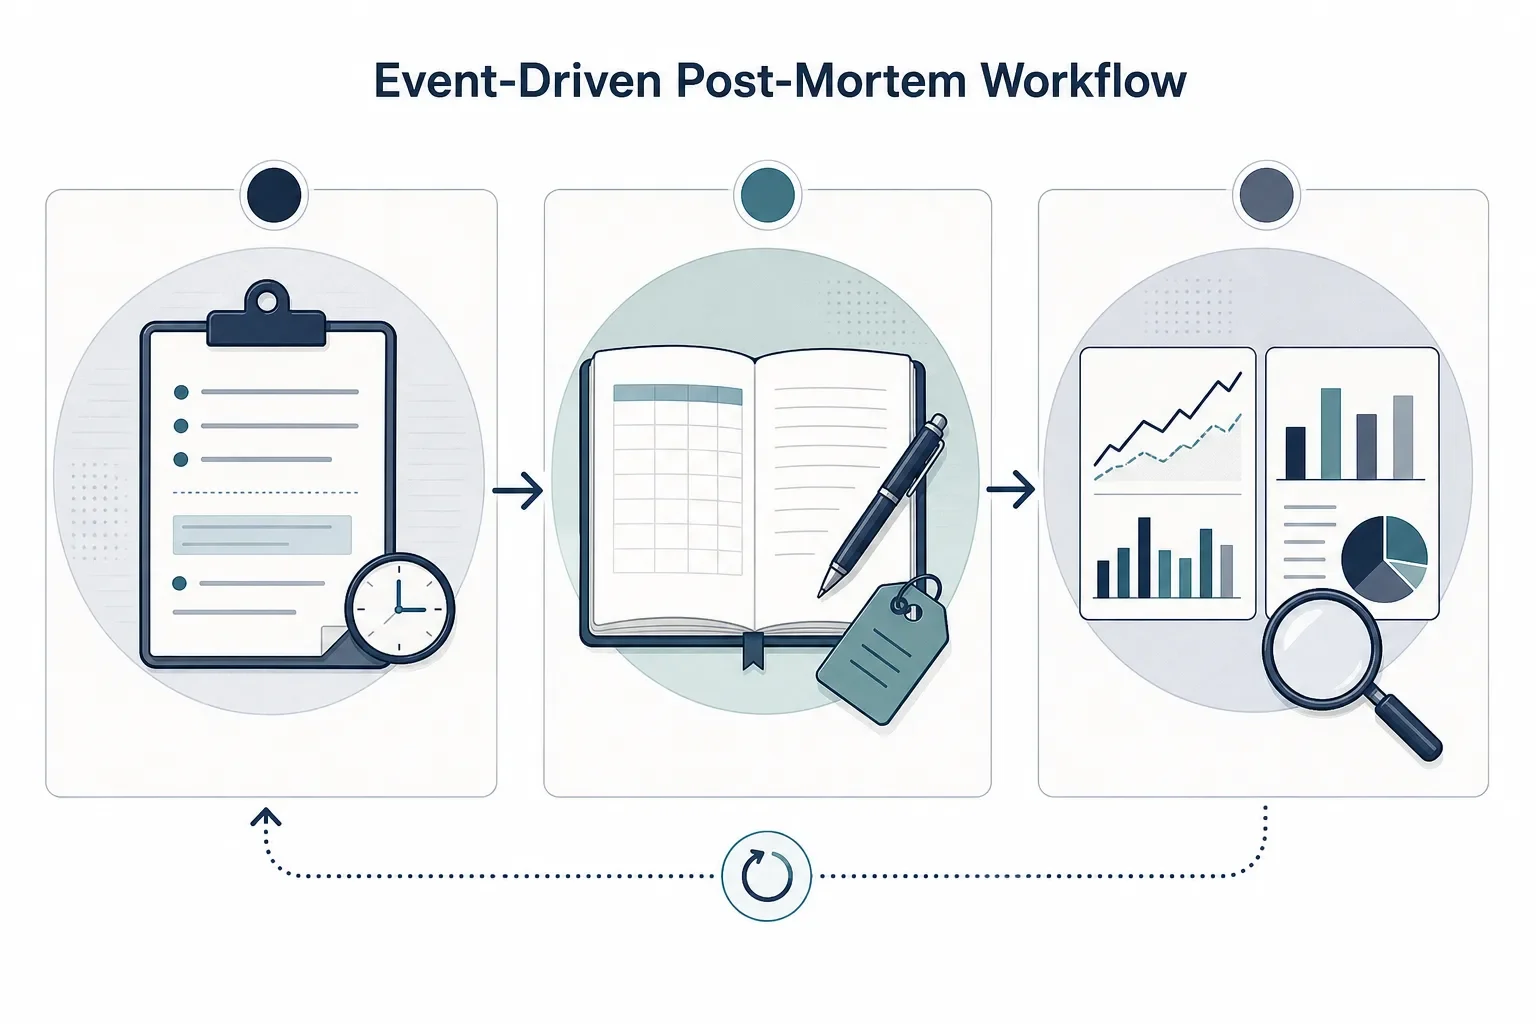
How to run an event-driven post‑mortem for your BTC strategy (step‑by‑step)
A step‑by‑step workflow for BTC event‑driven post‑mortems: record rules, log trades, compare pre/event/post windows using Trade Strategy to identify rule breakpoints and create testable updates.
 2026-08-07
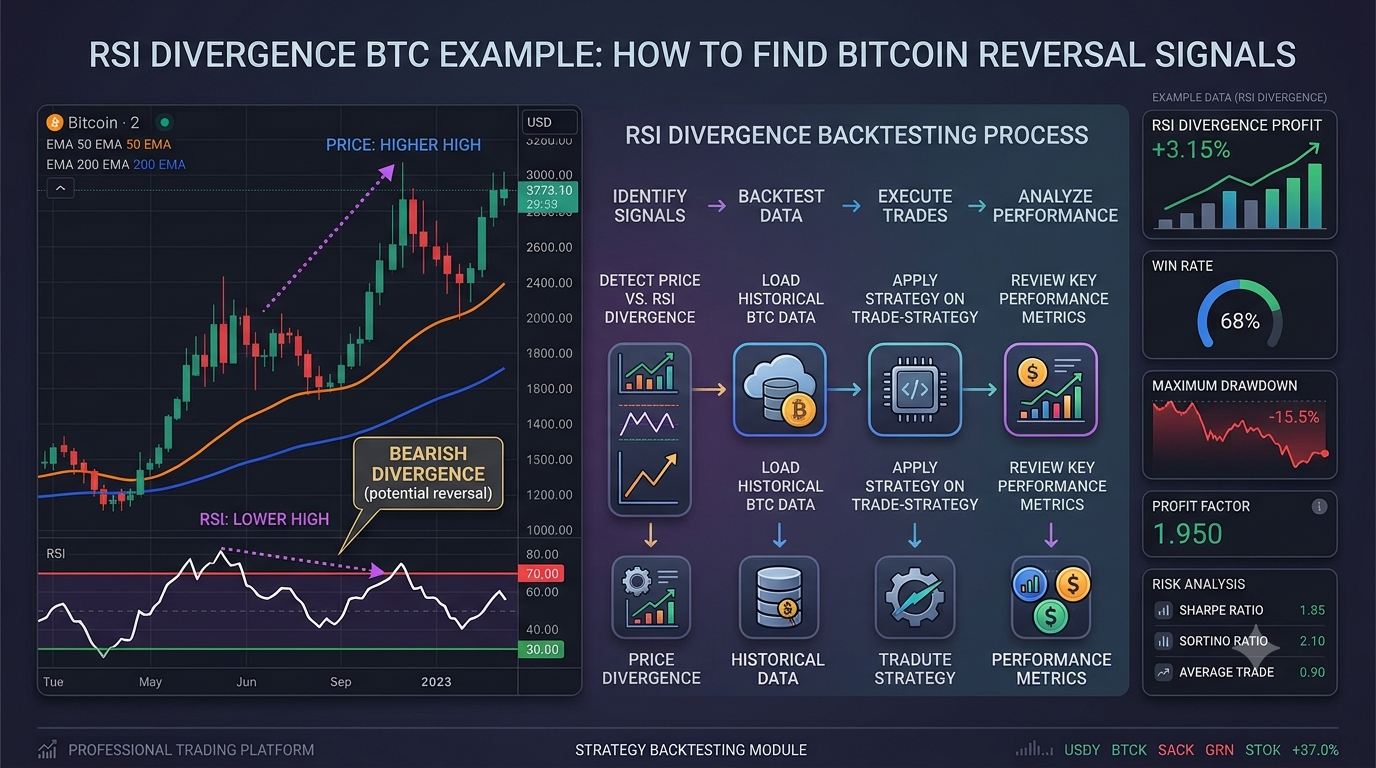
BTC Paper Trading Strategy: How to Test Bitcoin Trading Without Risking Real Money
Discover how BTC paper trading works and why every beginner trader should use simulation before risking real money. Learn how to build a Bitcoin paper trading strategy, analyze historical data, evaluate backtest results, and test your ideas using Trade-Strategy.
 2026-08-01
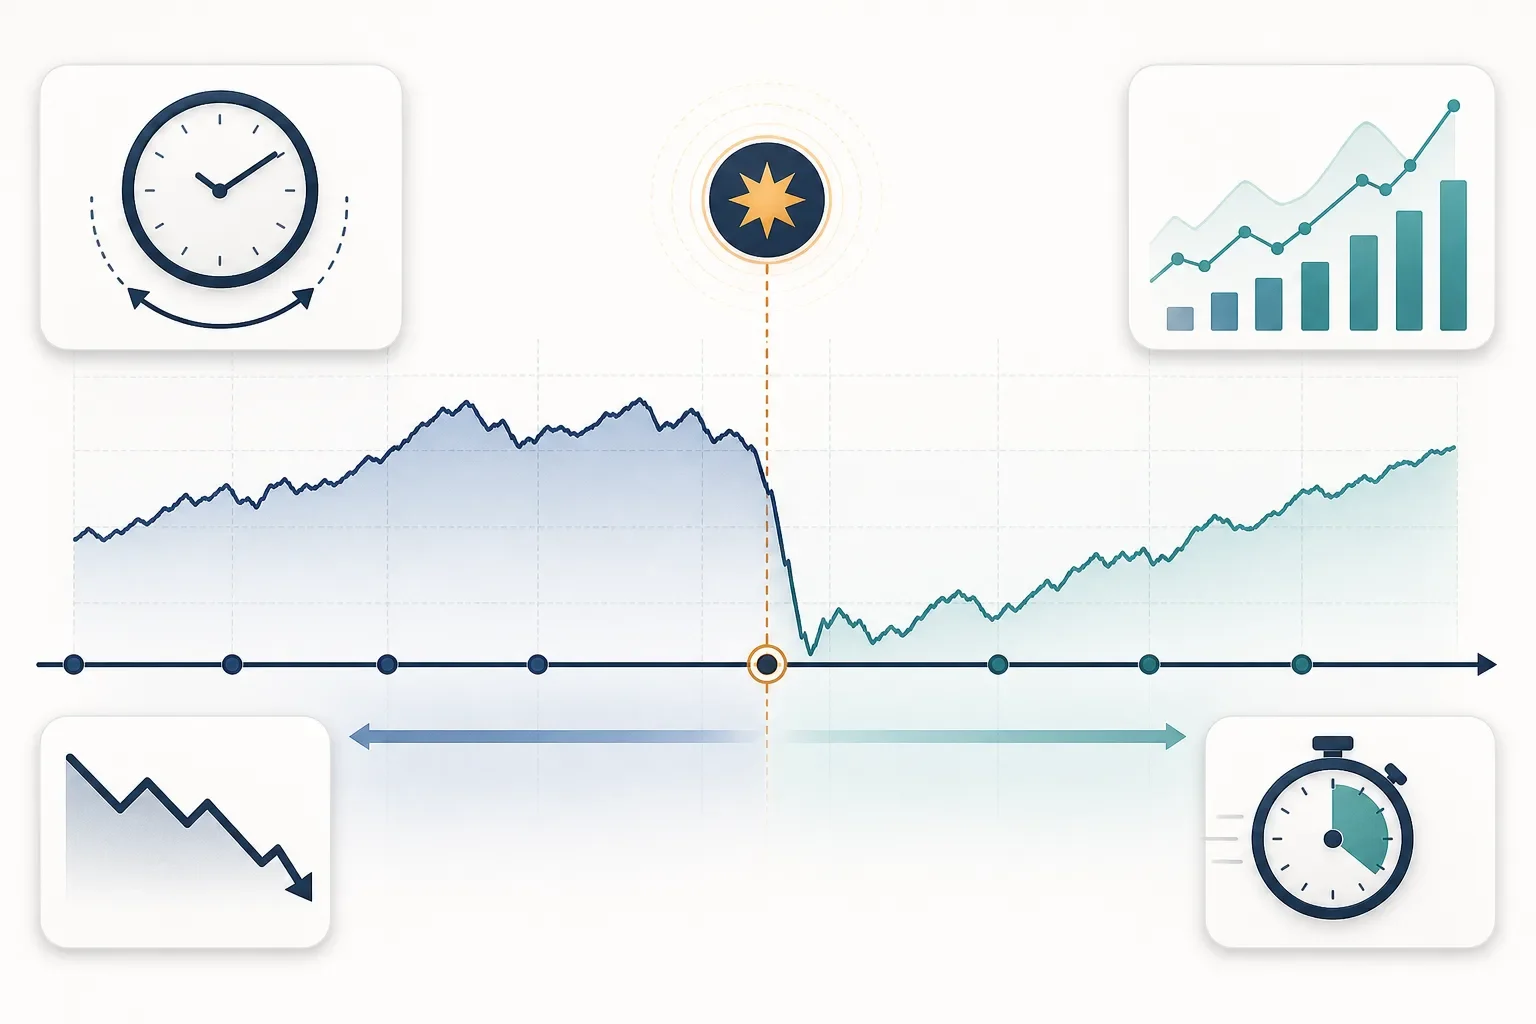
How ETF Flows and Geopolitics Move Bitcoin - Quantifying the Effect for Strategy Builders
A practical walkthrough for traders: combine manual news annotations with Trade Strategy’s released tools to quantify whether ETF flows or geopolitical headlines caused BTC drawdowns. Includes a post-mortem template and demo dataset.