
Adapting Trading Strategies for an Institutionalized Crypto Market: A Step-by-Step Regime‑Shift Audit
A practical playbook for quant teams to audit strategies after rising institutional flow: KPIs to rebaseline, a 9-step regime‑shift audit workflow, a Regime Review template and short case examples.
# Adapting Trading Strategies for an Institutionalized Crypto Market: A Step-by-Step Regime‑Shift Audit
Institutional participation in crypto has increased in recent years. For systematic traders, quant teams and trading ops, that shift can change market microstructure: intraday liquidity curves, execution patterns and volatility regimes evolve as larger, programmatic orders interact with existing retail flow. Re-running backtests, rebaselining KPIs and documenting assumptions are essential steps before you accept live performance under the new conditions.
This playbook explains why market structure can change, which KPIs to rebaseline, and gives a practical, repeatable 9-step "regime‑shift audit" you can run today. Use the Regime Review checklist below to make findings reproducible across strategies.
## Why institutionalization changes the trading environment
- Lower headline volatility, different liquidity profile: institutional order flow can smooth retail-driven spikes while concentrating liquidity into larger fills. That may reduce headline realized volatility while increasing the incidence of discrete market-impact events.
- Different execution patterns: institutions commonly use participation or VWAP-style algorithms that reshape intraday liquidity and queue dynamics compared with more fragmented retail activity.
- Cross-market interaction: programmatic institutional strategies can raise correlations across assets and venues, affecting hedging and diversification assumptions.
When inputs calibrated to a retail-dominated regime (higher short-lived spikes, shallow but frequent liquidity) meet a market with larger, smoother institutional flow, key assumptions on slippage, fill rates, and edge persistence can break down.
## KPIs to rebaseline (and why they matter)
Volatility measures
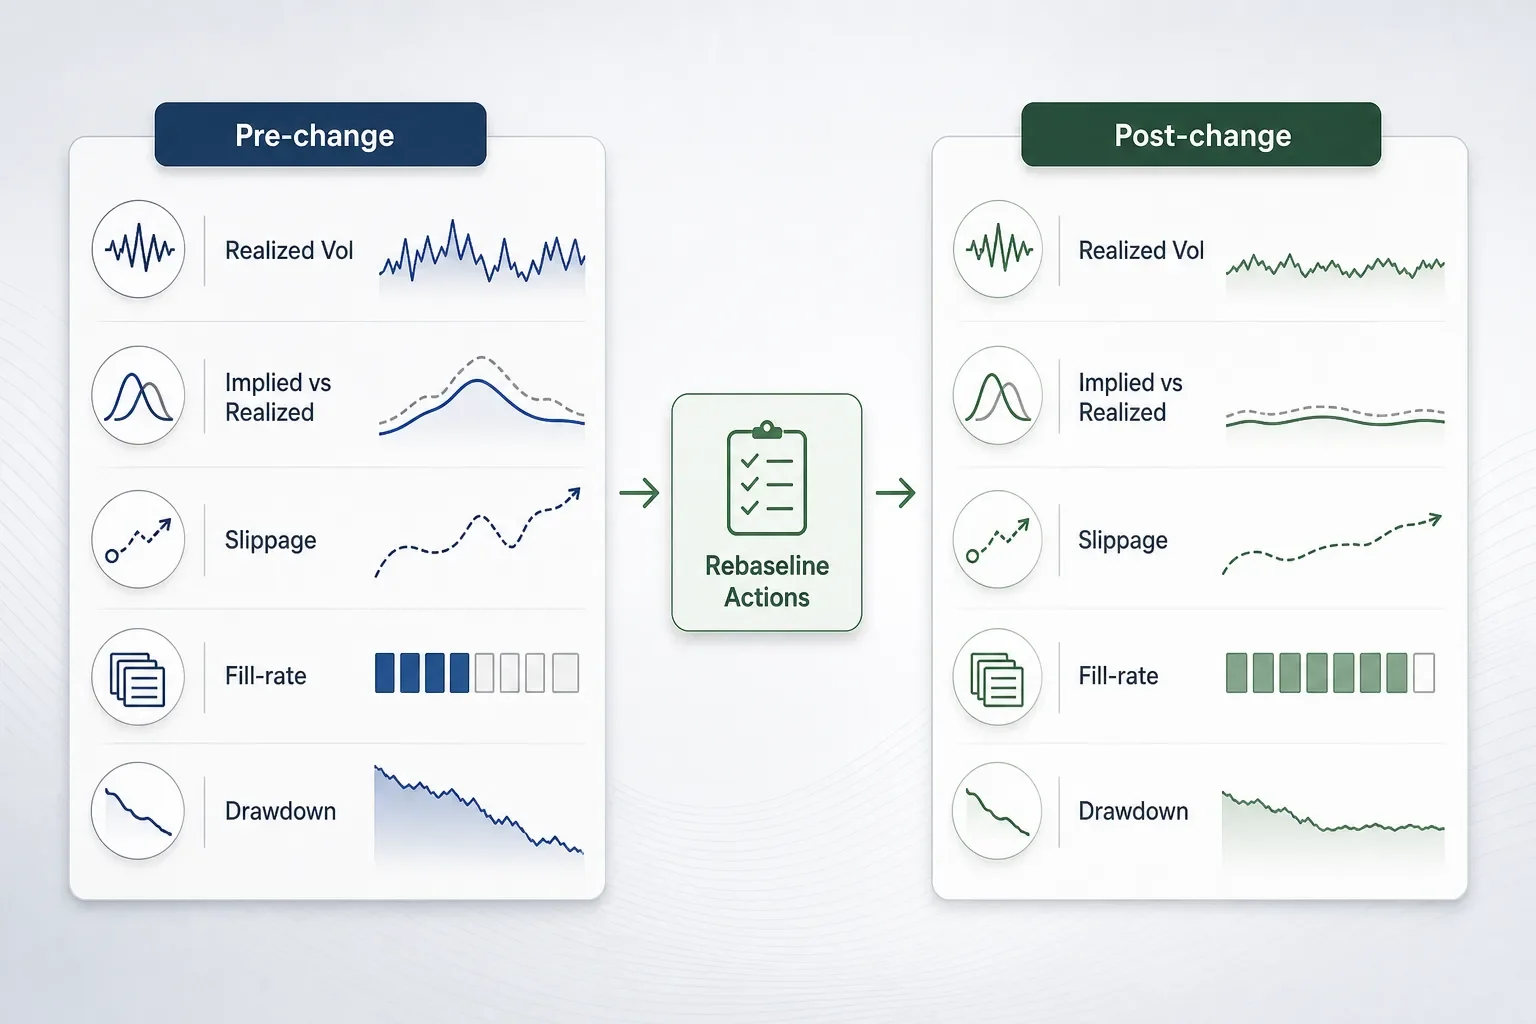
- Realized vs. Implied Volatility: Compare recent realized volatility with the historical sample used in your tests. A persistent gap suggests option-pricing, sizing or risk models need recalibration.
Execution-quality metrics
- Slippage and Market Impact: Measure slippage relative to the intended price (limit or midpoint) and estimate temporary vs. permanent impact. Institutional flow can reduce average slippage while increasing the frequency of isolated large-impact events.
- Fill Rates & Partial Fills: Track full fills, partial fills and cancellations by order type, size and venue.
Risk and return profile
- Drawdown Behavior: Re-examine maximum drawdown, time-to-recovery and tail-loss measures (e.g., expected shortfall) under the new regime.
- Hit Rate and Edge Decay: If your edge relied on short-lived retail mispricings, monitor hit-rate degradation and sensitivity to execution latency.
Capacity & Scalability
- Liquidity depth at target execution sizes and how slippage scales with notional.
Microstructure signals
- Order-book depth, imbalance statistics and queue-position dynamics during typical execution windows.
## A 9-step regime‑shift audit workflow
1. Define the candidate regime change
- Specify the timeframe and the indicators that will mark the regime (for example: sustained increase in institutional share, a multi-week shift in realized volatility, or persistent changes in fill rates).
2. Segment historical data
- Split your historical data into pre-change and post-change windows. Use consistent data sources and align timestamps across venues to avoid measurement bias.
3. Re-run strategy backtests segmented by regime
- Run identical logic across both windows. Keep execution models and slippage assumptions constant so differences reflect market change rather than modeling drift.
4. Rebaseline primary KPIs
- Compare realized/implied volatility, slippage, fill rates, drawdown metrics and edge statistics between regimes and document gaps.
5. Sensitivity and capacity testing
- Stress test sizing assumptions and simulate larger order sizes to measure impact on slippage, P&L dispersion and capacity limits.
6. Execution-path analysis
- Analyze orders by time-of-day, venue and order type. Identify when fills degraded or improved and when market impact spikes occur.
7. Update risk & sizing rules
- Where KPIs shift materially, prescribe new per-trade size limits, stop rules and portfolio-level constraints. Make these changes explicit and test them in the recent window.
8. Document assumptions and decisions
- Record the regime definition, test results, updated rules and open questions in a single Regime Review document so the audit is reproducible.
9. Monitor and automate alerts
- Set monitoring thresholds for the KPIs you rebased and trigger a review when thresholds are crossed.
## Regime Review template (use as a checklist)
- Title and date
- Regime definition (indicators & thresholds)
- Data windows compared (start/end dates)
- Key KPIs: realized vol, implied vol, slippage, fill rates, drawdown, hit-rate
- Backtest snapshots: pre/post performance metrics and execution assumptions
- Sensitivity test results (size vs. slippage table)
- Updated risk limits and sizing rules
- Execution adjustments (preferred order types, venue routing changes)
- Open risks and follow-ups (data gaps, model limitations)
- Review cadence and owners
Download the Regime Review template from https://trade-strategy.com/blog (or paste the checklist into your strategy notebook). Paste one Regime Review per strategy and per significant market-change event.
## Short case examples (hypothetical)
Example A — Mean-reversion intraday strategy
- Observation: Post-institutional shift, realized volatility declined materially compared with the test period; mean-reversion signals weakened and hit-rate dropped.
- Audit actions: Re-run backtests on the recent window, reduce target position size, widen stop thresholds to avoid being stopped out by infrequent but larger institutional prints, and document the new sizing policy in your Regime Review.
Example B — Passive liquidity-provider (spread capture)
- Observation: Spread compression reduced per-trade nominal capture in some periods, while larger block fills appeared in other windows.
- Audit actions: Allocate part of execution toward time-weighted algorithms during institutional windows, increase monitoring for block fills and update capacity limits to reflect the new fill distribution.
## Practical tips for teams
- Automate regime segmentation: Run daily or weekly checks that flag when core KPIs deviate beyond tolerance bands and surface flagged strategies for review.
- Make audits reproducible: Store queries, backtest parameters and execution assumptions alongside results so another engineer or quant can re-run the audit.
- Version-control decisions: Treat each Regime Review like change control — include author, rationale and rollback criteria.
- Use platform features where helpful: Strategy Management can record rules and assumptions, the Historical Results Journal can store outcomes across regimes, and Strategy Comparison can help test alternatives. If you use AI recommendations, treat them as probabilistic decision support rather than certainties.
## Conclusion
A durable increase in institutional participation changes liquidity, volatility and execution dynamics. Systematic traders who treat that change as a regime shift — and run a structured audit to rebaseline KPIs, update sizing and document decisions — reduce operational surprise and make more defensible strategy adjustments.
Regime reviews do not guarantee performance; they create reproducible, data-driven decisions you can review and iterate. Download the Regime Review template from https://trade-strategy.com/blog and set a cadence for reassessment when core KPIs move outside your tolerance bands.
To document and compare regime reviews across strategies, learn more about Trade Strategy at https://trade-strategy.com
 2026-08-11
Exchange News Trading Checklist: A Practical 5‑Point Playbook
A fast, repeatable 5‑point checklist to assess liquidity, tag event trades, and stress-test strategy variants after exchange revenue misses or similar venue shocks.
 2026-07-30
How to run a trading-strategy post‑mortem after an exchange outage
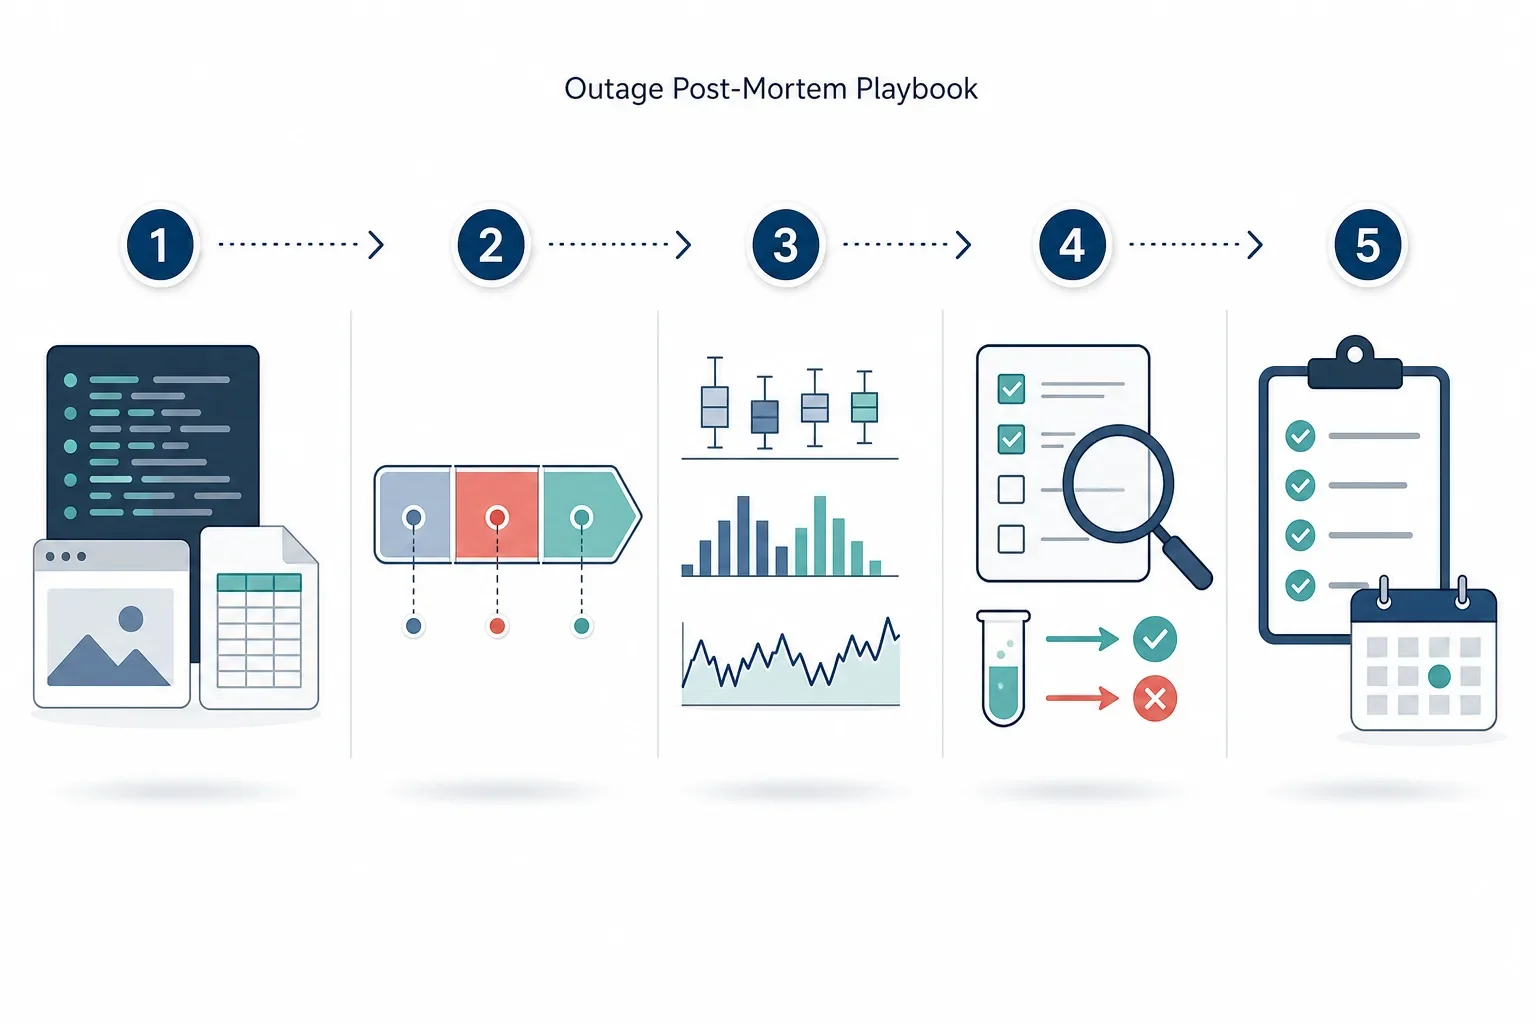
Step‑by‑step post‑mortem guide for derivatives traders: collect execution artifacts, build a timeline, compute normalized slippage and fill metrics, and translate findings into process changes with a ready‑to‑use template.
 2026-08-11
How to run an event-driven post‑mortem for your BTC strategy (step‑by‑step)
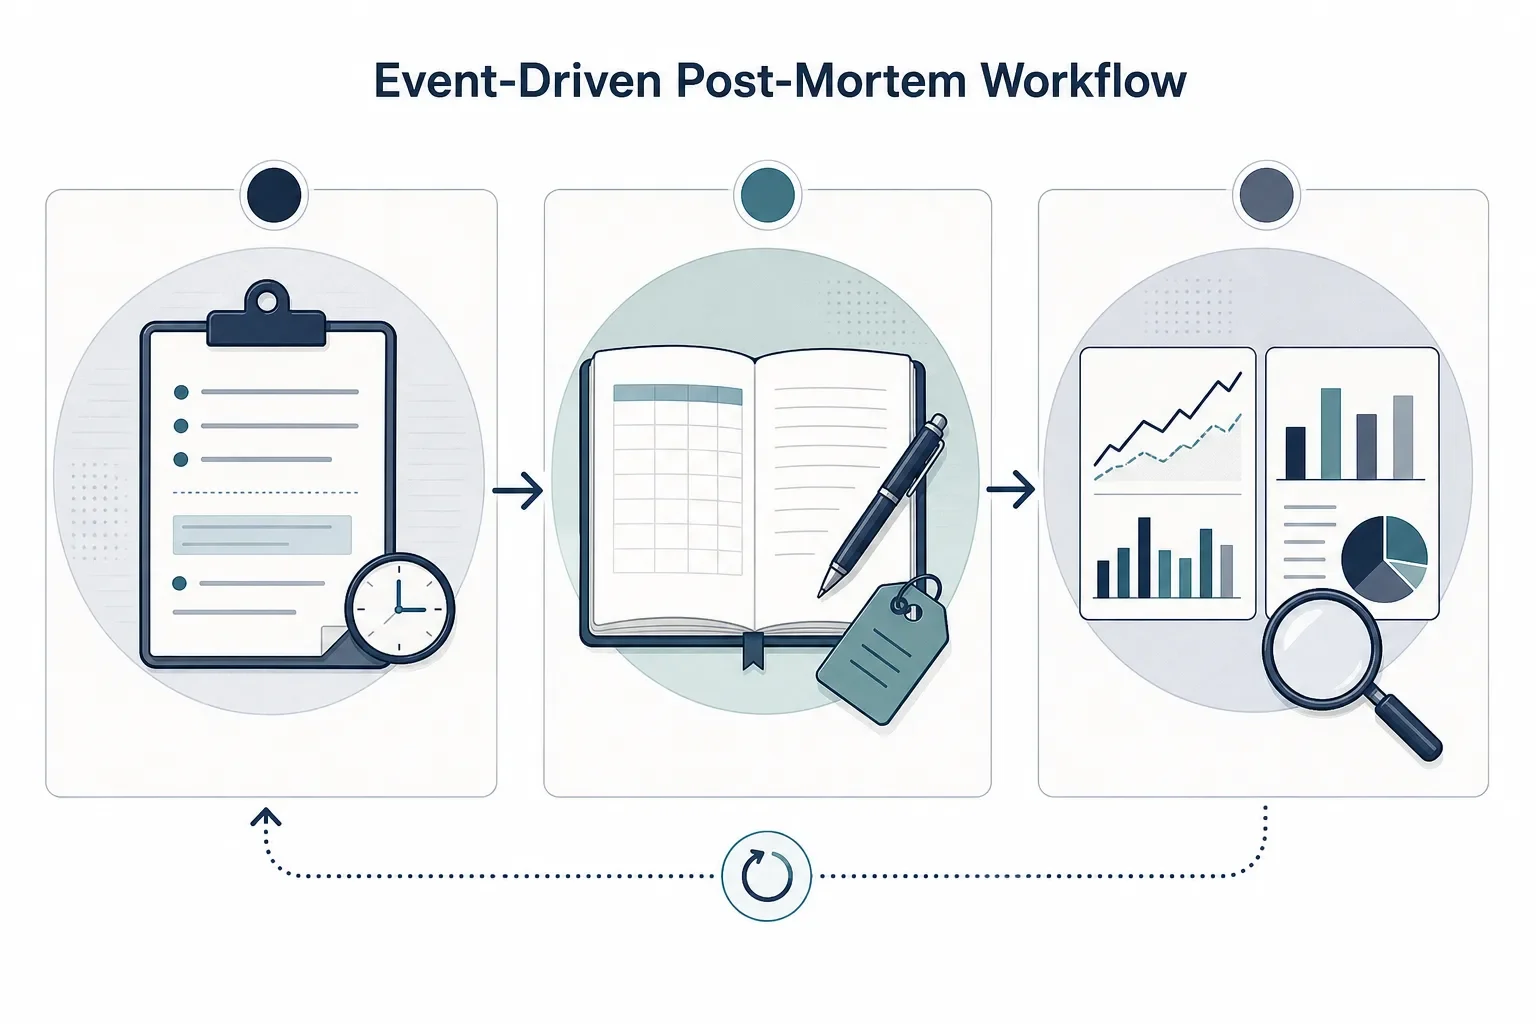
A step‑by‑step workflow for BTC event‑driven post‑mortems: record rules, log trades, compare pre/event/post windows using Trade Strategy to identify rule breakpoints and create testable updates.