
How to run a trading-strategy post‑mortem after an exchange outage
Step‑by‑step post‑mortem guide for derivatives traders: collect execution artifacts, build a timeline, compute normalized slippage and fill metrics, and translate findings into process changes with a ready‑to‑use template.
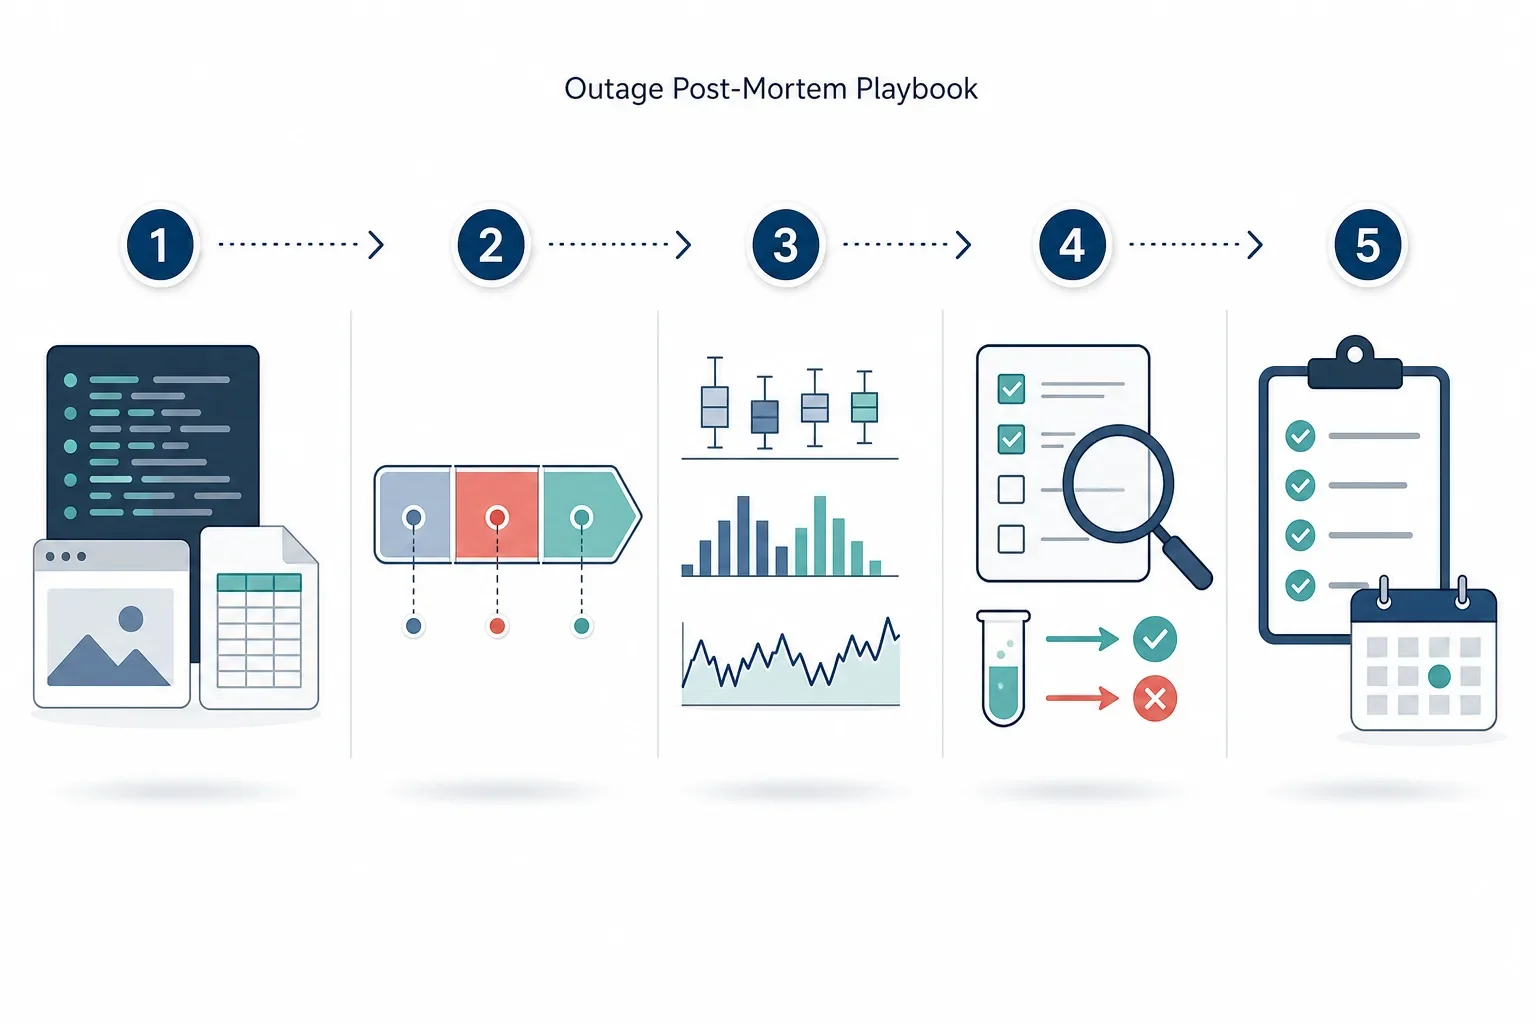
# When an exchange goes dark, your playbook must be more than memory — it needs recorded evidence
Exchange outages expose gaps in execution, liquidity and contingency planning. For margin and derivatives traders, the immediate scramble is familiar; the less familiar discipline is the post‑mortem. This guide provides a practical, step‑by‑step process to document assumptions, capture fills and slippage, and compare pre‑ vs post‑outage performance. Included: an outage post‑mortem template and example entries oriented to margin and derivatives strategies.
## 1. Immediate objectives during an outage
Capture what you can while facts are fresh. Prioritize artifacts that prove what happened and why a trade behaved differently than expected:
- Record a concise timeline: first detection, exchange status page messages, order-rejection/error times, and time access was restored.
- Export or copy execution logs (OMS/terminal logs, order IDs, timestamps, size, side, price, and response codes).
- Save screenshots of terminal errors, exchange status pages and account pages (balances, positions, margin rates).
- Note manual actions taken (forced cancels, off‑exchange hedges, balance transfers) and why.
These primary artifacts are the raw inputs to a reliable post‑mortem and will support later quantitative comparison.
## 2. Build the outage timeline
A clear timeline is the spine of any post‑mortem. Reconstruct the event in three phases:
- Pre‑outage baseline window (e.g., 7 days prior) — used for comparison. Include normal spreads, fills and volatility.
- Outage window — from first detection to confirmed recovery.
- Recovery window (e.g., 24–72 hours after) — how markets normalized and any delayed effects.
For each phase, list key observations: spreads, funding rates for perpetuals, liquidity at top N levels, and whether leverage or margin requirements changed.
### Example timeline snippet
- 2024‑07‑26 13:02 UTC — API timeouts observed
- 2024‑07‑26 13:05 UTC — Exchange status page: “Investigating connectivity issues”
- 2024‑07‑26 13:08–13:40 UTC — Orders rejected with error code 503; several partial fills reported
- 2024‑07‑26 14:15 UTC — System regained order acceptance; funding tick occurred at 14:30
## 3. What to capture in the results journal
A structured results journal makes later comparison possible. For each trade or order impacted by the outage, capture:
- Strategy name / ID
- Instrument (e.g., BTC-PERP) and contract size
- Intended action (entry/exit, size, price, order type)
- Order ID(s), timestamps (local and exchange), responses
- Executed fills: size, price, fee, average price
- Expected fill/benchmark price (mid, best bid/ask, or theoretical model)
- Slippage (executed price minus expected), expressed absolute and percent
- Fill rate (executed size / intended size)
- Reason code (timeout, rejected, partial fill, canceled by user)
- Position and margin state changes (margin used, margin calls, maintenance margin breaches)
- Manual interventions and communications (to desk, exchange support)
Store this data in a consistent format (CSV or database) to enable quantitative comparison and auditability.
## 4. Quantifying impact: metrics to compute
For each strategy and phase compute common metrics:
- Average slippage per order (and distribution)
- Fill rate (%) and partial fill frequency
- Time‑to‑fill and time‑to‑cancel distributions
- Net realized PnL attributable to execution differences (separate from signal performance)
- Incidence of forced deleveraging or liquidations
- Change in bid/ask spread and top‑of‑book depth
Compare each metric between baseline and outage windows. For example, teams often see slippage increase substantially and fill rates fall during outages — quantify changes from your baseline rather than relying on anecdote.
## 5. Normalize and control for market conditions
Outages frequently coincide with elevated volatility. Normalization reduces false attributions:
- Use volatility‑adjusted slippage (slippage divided by realized volatility for the period).
- Compare with baseline days that exhibit similar volatility, not just calendar days.
- Where possible, use cross‑exchange data to separate exchange operational issues from market‑wide moves.
Practical note: if all venues show similar dislocation, the root cause may be market‑wide. If only one venue diverges, operational causes are more likely.
## 6. Root causes and hypothesis testing
Turn observations into testable hypotheses and list the evidence needed for each:
- Hypothesis A: API throttling caused delayed cancels leading to partial fills. Evidence: repeated 429/503 response codes, queued requests in client logs.
- Hypothesis B: Exchange withdrew liquidity or widened internal spreads, inflating slippage. Evidence: orderbook snapshots showing depth collapse, unusual funding or insurance actions.
For each hypothesis define tests to run (replay fills, synthetic order submission in sandbox, correlation with other venues) and mark whether evidence supports, refutes or is inconclusive.
## 7. Post‑mortem template
Use the following template for each impacted strategy or significant incident:
- Incident ID:
- Strategy name / ID:
- Instruments affected:
- Outage start / end (UTC):
- Summary description:
- Timeline (key events):
- Artifacts collected (logs, screenshots, exchange statements):
- Quantitative impact (slippage, fill rate, PnL delta):
- Root cause hypotheses and supporting evidence:
- Immediate corrective actions taken:
- Recommended process changes / follow‑ups:
- Owner and due date for each follow‑up:
Include attachments or links to raw artifacts so reviewers can verify conclusions.
## 8. Example entries (abbreviated)
1) Incident ID: OUT-20240726-01
- Strategy: Short volatility perpetuals
- Instrument: BTC-PERP
- Outage: 13:05–14:15 UTC
- Observed: Intended market sell 10 BTC @30,000; executed 6.0 BTC @30,200 avg; remainder canceled. Slippage +200 USD per BTC (0.67%). Margin utilization spiked; no forced liquidation.
- Impact: Realized PnL lower vs expected execution; lower hedge efficiency for the recovery period.
- Action: Add explicit partial‑fill handling policy; log expected vs executed for each market order.
2) Incident ID: OUT-20240726-02
- Strategy: Trend-entry scaled longs
- Instrument: BTC-PERP
- Observed: Limit orders placed; exchange returned 503 errors for 12 minutes and later accepted duplicate orders leading to unintended increased exposure.
- Impact: Increased exposure; required manual reduction to rebalance risk.
- Action: Implement client‑side idempotency checks and duplicate detection in the execution layer.
## 9. Actionable checklist to reduce future impact
- Archive execution logs centrally and in immutable form.
- Configure alerts for unusual fill rate, spread spikes or API errors.
- Define explicit manual‑intervention rules for outages (how much to hedge, when to reduce size).
- Build idempotency and offline reconciliation into execution scripts.
- Maintain minimum cross‑exchange collateral to preserve margin access if one venue becomes unavailable.
## Using Trade Strategy to support post‑mortems
Users can create and organize trading strategies. Users can record and monitor historical strategy results. Users can compare strategies using saved information and historical results. These capabilities help teams keep assumptions, artifacts and quantitative results in one place for faster, repeatable post‑mortems — without implying execution or guaranteed outcomes.
## Conclusion
An outage is chaotic; the post‑mortem is where you turn chaos into learning. Capture structured evidence immediately, normalize metrics for market conditions, and convert findings into concrete process changes. Start with the template above and commit to recording the facts — memory and anecdotes won’t survive a fast market.
Document outage impacts using Trade Strategy’s Historical Results Journal — learn more on our blog: https://trade-strategy.com/blog
 2026-08-11
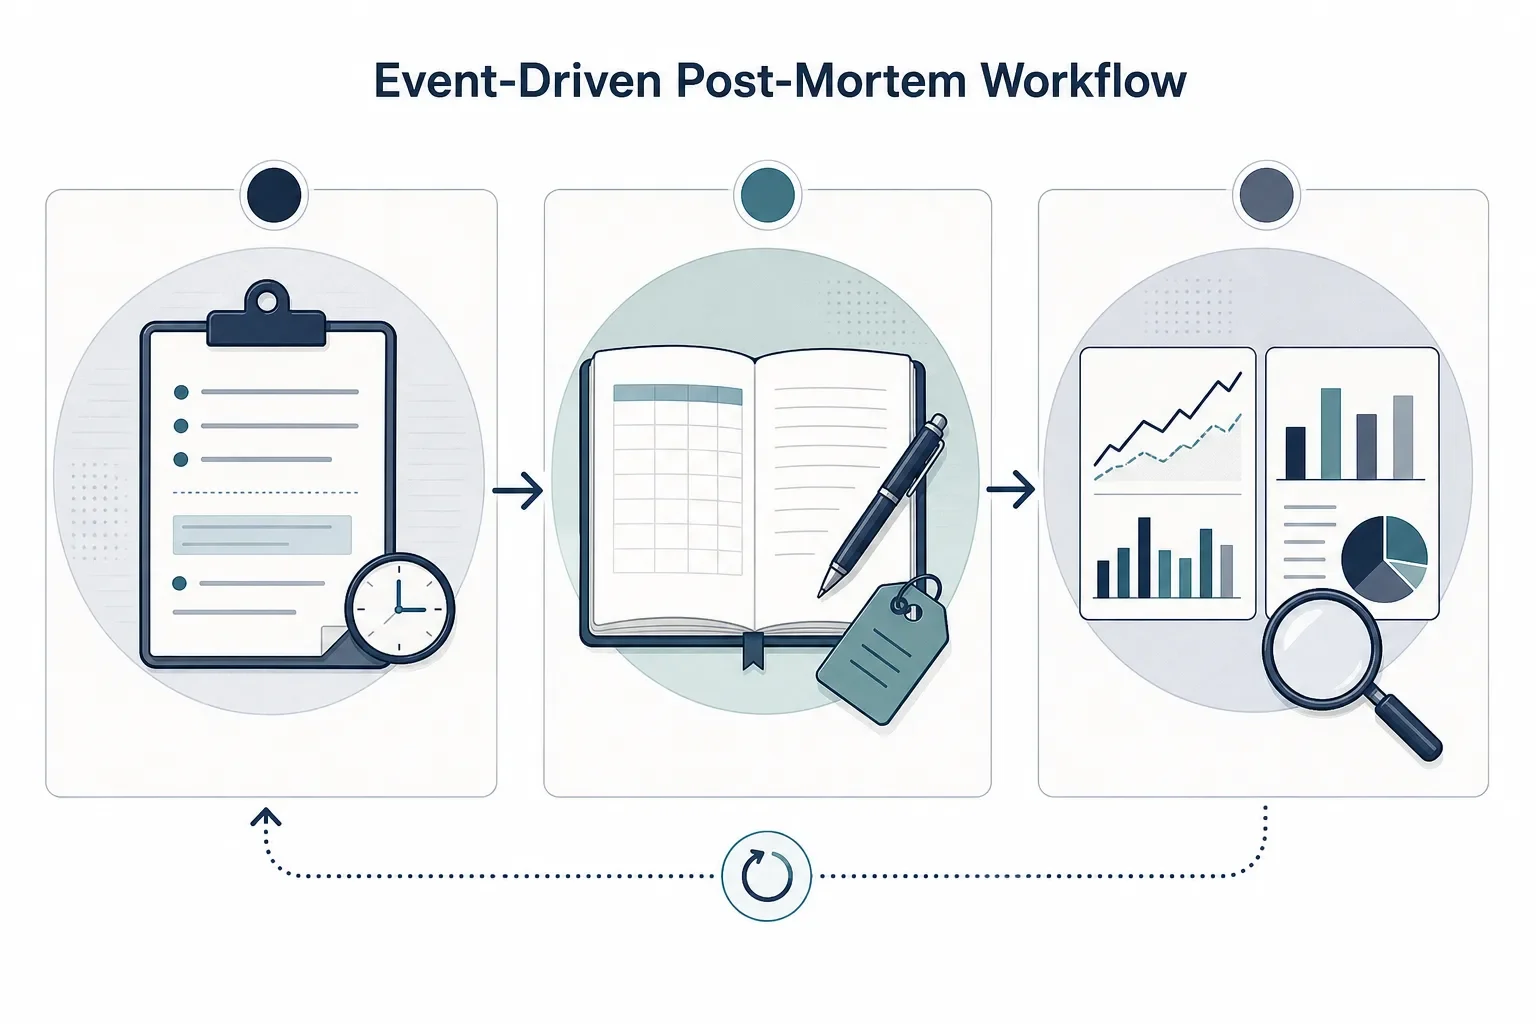
How to run an event-driven post‑mortem for your BTC strategy (step‑by‑step)
A step‑by‑step workflow for BTC event‑driven post‑mortems: record rules, log trades, compare pre/event/post windows using Trade Strategy to identify rule breakpoints and create testable updates.
 2026-08-11
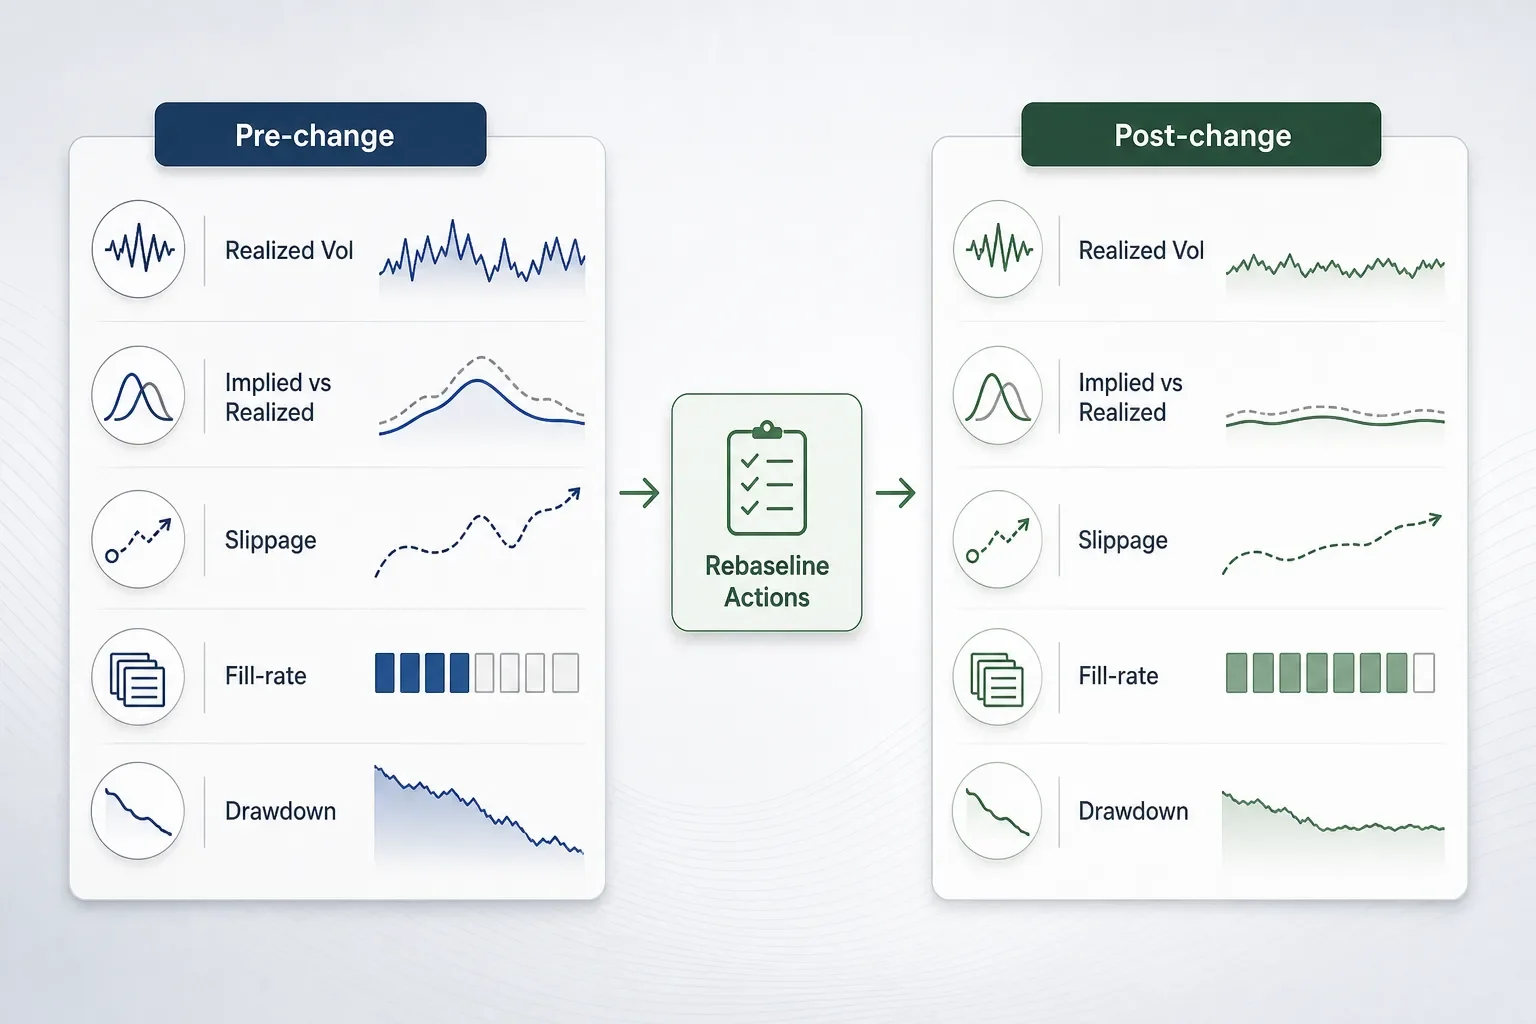
Adapting Trading Strategies for an Institutionalized Crypto Market: A Step-by-Step Regime‑Shift Audit
A practical playbook for quant teams to audit strategies after rising institutional flow: KPIs to rebaseline, a 9-step regime‑shift audit workflow, a Regime Review template and short case examples.
 2026-08-11
Exchange News Trading Checklist: A Practical 5‑Point Playbook
A fast, repeatable 5‑point checklist to assess liquidity, tag event trades, and stress-test strategy variants after exchange revenue misses or similar venue shocks.