
What the CME–CFTC Fight Means for Your Perpetual‑Futures Strategies — A Trader’s Checklist & Test Plan
A practical checklist and reproducible test plan to audit and re‑test perpetual‑futures strategies across CME‑style and onchain venues. Includes templates and hypothetical case studies to help teams quantify venue‑driven risks.
# What the CME–CFTC Fight Means for Your Perpetual‑Futures Strategies
Regulatory scrutiny of onchain perpetuals can change liquidity, funding mechanics and venue access. Treat this as an operational trigger: re‑test strategies, document venue‑specific behavior, and verify assumptions under changed market‑structure conditions.
This article provides a concise risk checklist, a reproducible cross‑venue experiment design, and ready‑to‑use templates for a strategy spec and a results journal so trading teams can rapidly re‑evaluate perpetual‑futures strategies across CME‑style and onchain venues.
## Quick orientation: why this matters now
Regulatory interventions can shift key drivers of perpetual performance: where liquidity sits, how funding is calculated and paid, settlement rules, and counterparty or custody constraints. Changes in any of these areas can alter slippage, funding exposure, execution latency and even your ability to access specific instruments. That means strategies that look identical on paper can behave differently across venues.
Treat the current environment like a systems test: identify assumptions, run controlled experiments across venues, and capture results so decisions are evidence‑based rather than narrative‑driven.
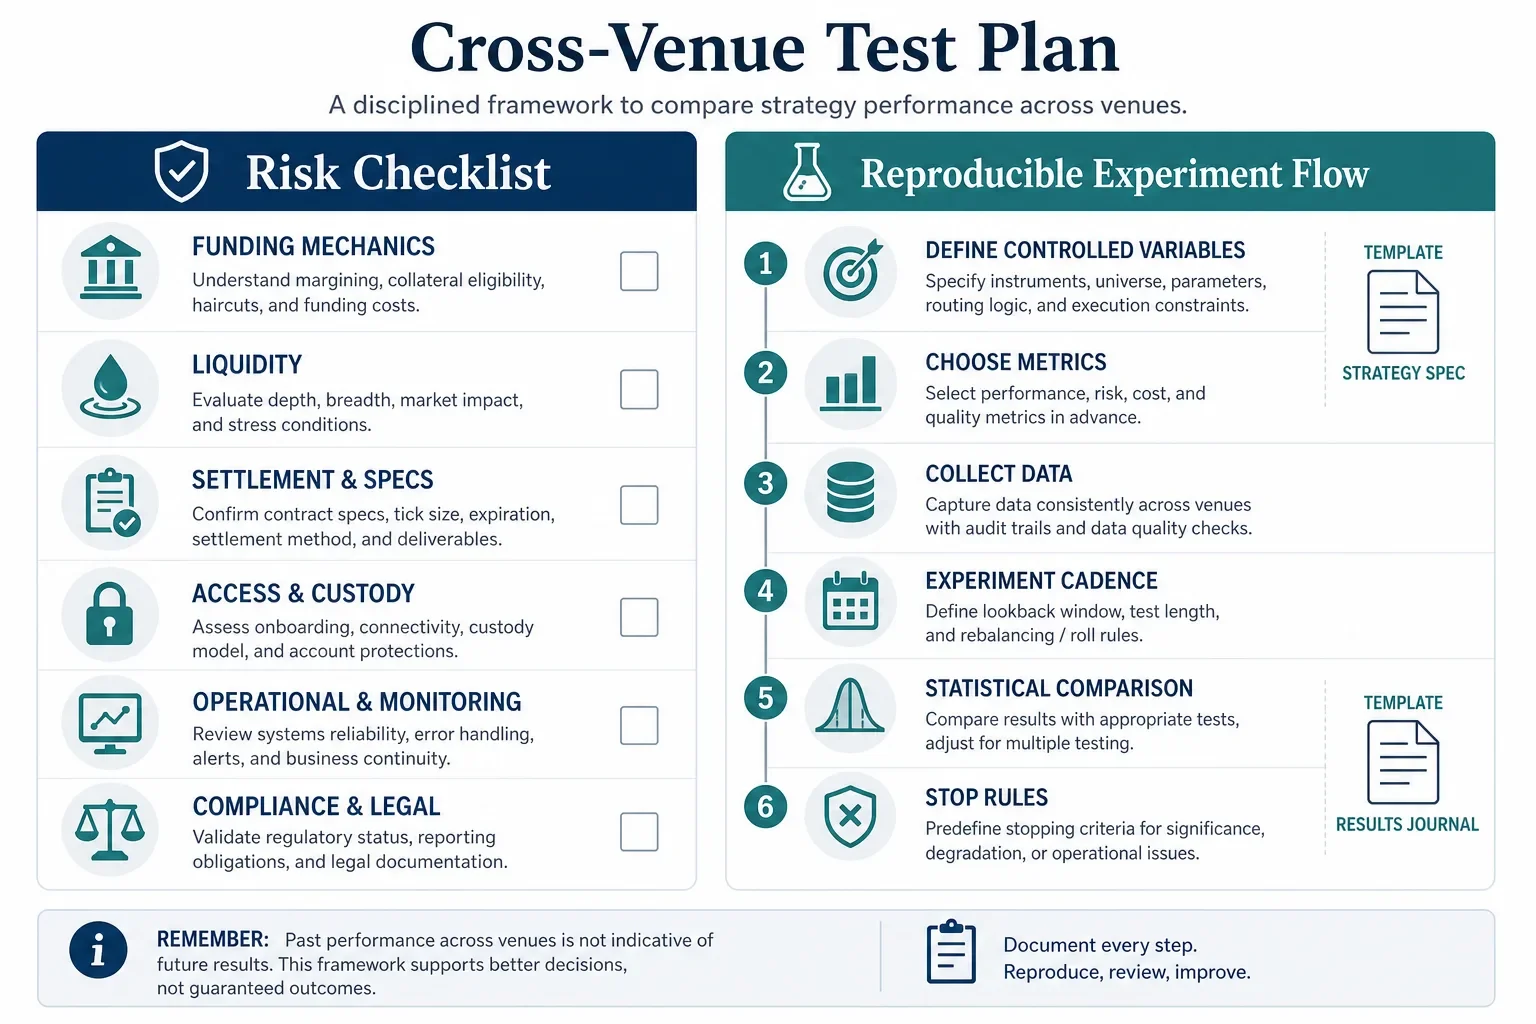
## Perpetual‑futures risk checklist
Use this checklist to audit each strategy and venue before and after any regulatory or venue changes.
- Funding mechanics
- Funding rate calculation: index used, sampling frequency, lookback window.
- Funding payment cadence: hourly, eight‑hourly, etc.; settlement timing relative to trade execution.
- Funding volatility: inspect tails and intraday swings rather than relying on daily averages.
- Short/long squeezes and funding‑sign switches in stressed markets.
- Liquidity
- Depth at relevant sizes (e.g., 1x, 5x, 10x notional) across top orderbook layers.
- Cross‑venue fragmentation: primary liquidity pools and correlation of fills.
- Available order types and their practical impact on execution quality (market, limit, post‑only).
- Settlement and contract specs
- Cash settlement vs perpetual behavior; settlement windows; index composition.
- Tick size, lot size, leverage caps, margin maintenance rules.
- Liquidation mechanics and contagion risk (auto‑liquidation timing, partial fills).
- Access, custody and counterparty
- KYC/AML constraints for accounts and counterparties.
- Onchain custody constraints, smart contract risks and oracle reliability.
- Counterparty concentration and margin transfer friction.
- Operational & monitoring
- Latency and execution routing differences by venue.
- Data quality: timestamps, funding reports, and fills reconciliation.
- Alerts and thresholds for sudden changes in funding or depth.
- Compliance & legal
- Changes to jurisdictional accessibility or reporting requirements.
- Internal documentation required for trade audit and risk committees.
## Reproducible cross‑venue experiment design
Goal: isolate venue‑driven performance differences for a given strategy under controlled conditions.
1. Define controlled variables
- Strategy rules (entry/exit, sizing, risk limits) — freeze across venues.
- Execution logic (order types and slicing algorithm) — keep consistent as allowed by each venue.
- Time window and market conditions to test (e.g., set of calm days plus volatile days).
2. Choose metrics
- Primary: gross P&L, slippage (realized vs theoretical), fill rate, average execution price vs mid, realized funding paid/received.
- Secondary: realized volatility exposure, peak margin usage, number of liquidations, latency to fill.
3. Data collection rules
- Record raw orderbook snapshots at fixed intervals (e.g., 1s or 5s) for the test period.
- Capture funding rates and index values at every funding payment timestamp.
- Log every order event (submit, amend, fill, cancel) with venue timestamps.
4. Experiment cadence
- Backtest on identical historical input where possible, then run parallel forward runs (paper or small capital) across venues.
- Forward‑run length: long enough to observe several funding cycles and at least one stressed‑day scenario (commonly 2–4 weeks depending on strategy frequency).
5. Statistical comparison
- Use paired comparisons for matched trade opportunities to compare slippage and fills.
- Compare distributions (e.g., funding paid per day) using non‑parametric tests if sample sizes are small.
- Report effect sizes and confidence intervals rather than only p‑values.
6. Stop rules and safety
- Predefine loss thresholds and margin‑exhaustion triggers to stop the experiment.
- Include manual checkpoints after each funding cycle for human review.
## Templates: strategy spec and results journal (compact)
Strategy spec (one page):
- Strategy name
- Objective and horizon (e.g., intraday mean‑reversion, market‑neutral)
- Instruments and venues included
- Entry rules (signal definitions, parameter values)
- Exit rules and risk limits (stop, take‑profit, max position)
- Sizing and leverage rules
- Execution policy (order types, slice size, max participation)
- Assumptions (funding neutrality, minimum liquidity levels)
- Pre‑conditions for running experiment (data feeds, accounts)
Results journal (for each run):
- Run ID and timestamps
- Venue and instrument
- Test window and market condition snapshot
- Trade‑level summary: number of trades, avg size, avg slippage
- Funding summary: total funding paid/received, avg funding per position‑hour
- Operational incidents: missed fills, oracle issues, margin events
- Notes: divergence from assumptions, suggested follow‑ups
Experiment comparison table (final report):
- Metric | Venue A (CME‑style) | Venue B (onchain) | Delta | Notes
- Gross P&L | | | |
- Avg slippage | | | |
- Funding (per day) | | | |
- Fill rate | | | |
- Execution latency | | | |
## Documenting and comparing results with Trade Strategy
Use Trade Strategy’s Strategy management to create and organize trading strategies and to document strategy rules and assumptions. Record and monitor historical strategy results using Trade Strategy’s Historical results journal. Compare strategies using saved information and recorded historical results with Trade Strategy’s Strategy comparison.
These capabilities help you keep structured records of your experiment setup, events and outcomes so downstream reviews (risk, compliance, portfolio) have a defensible audit trail. Note: Trade Strategy is a decision‑support platform and does not execute trades.
## Two short hypothetical case studies
Hypothetical A — Funding surprise:
A strategy relying on small, predictable funding payments experienced a funding flip on an onchain venue during a liquidity‑stress window. Differences in aggregation methodology and index sampling caused wider intraday swings vs. the centralized venue, increasing realized funding expense and compressing net returns for that run.
Hypothetical B — Liquidity fragmentation:
An intraday scalping strategy using aggressive limit orders found deeper, more consistent depth on a regulated venue during volatility. Onchain venues showed patchier depth across multiple liquidity pools, producing higher slippage for the same notional size.
(These case studies are hypothetical examples to illustrate where differences can arise; they are not guarantees or predictions.)
## Conclusion — practical next steps for trading teams
1. Run the checklist on each active strategy and venue this week.
2. Design a short, reproducible cross‑venue experiment and run a paper‑forward test covering several funding cycles.
3. Capture results in the strategy spec and results journal templates above and use paired comparisons to quantify differences.
4. Feed outcomes into trade review and compliance processes; update stop rules and access policies where needed.
This article is for informational purposes and operational guidance only; it is not personalized financial advice.
Document and compare your cross‑venue tests with Trade Strategy. Learn more: https://trade-strategy.com/blog
 2026-08-11
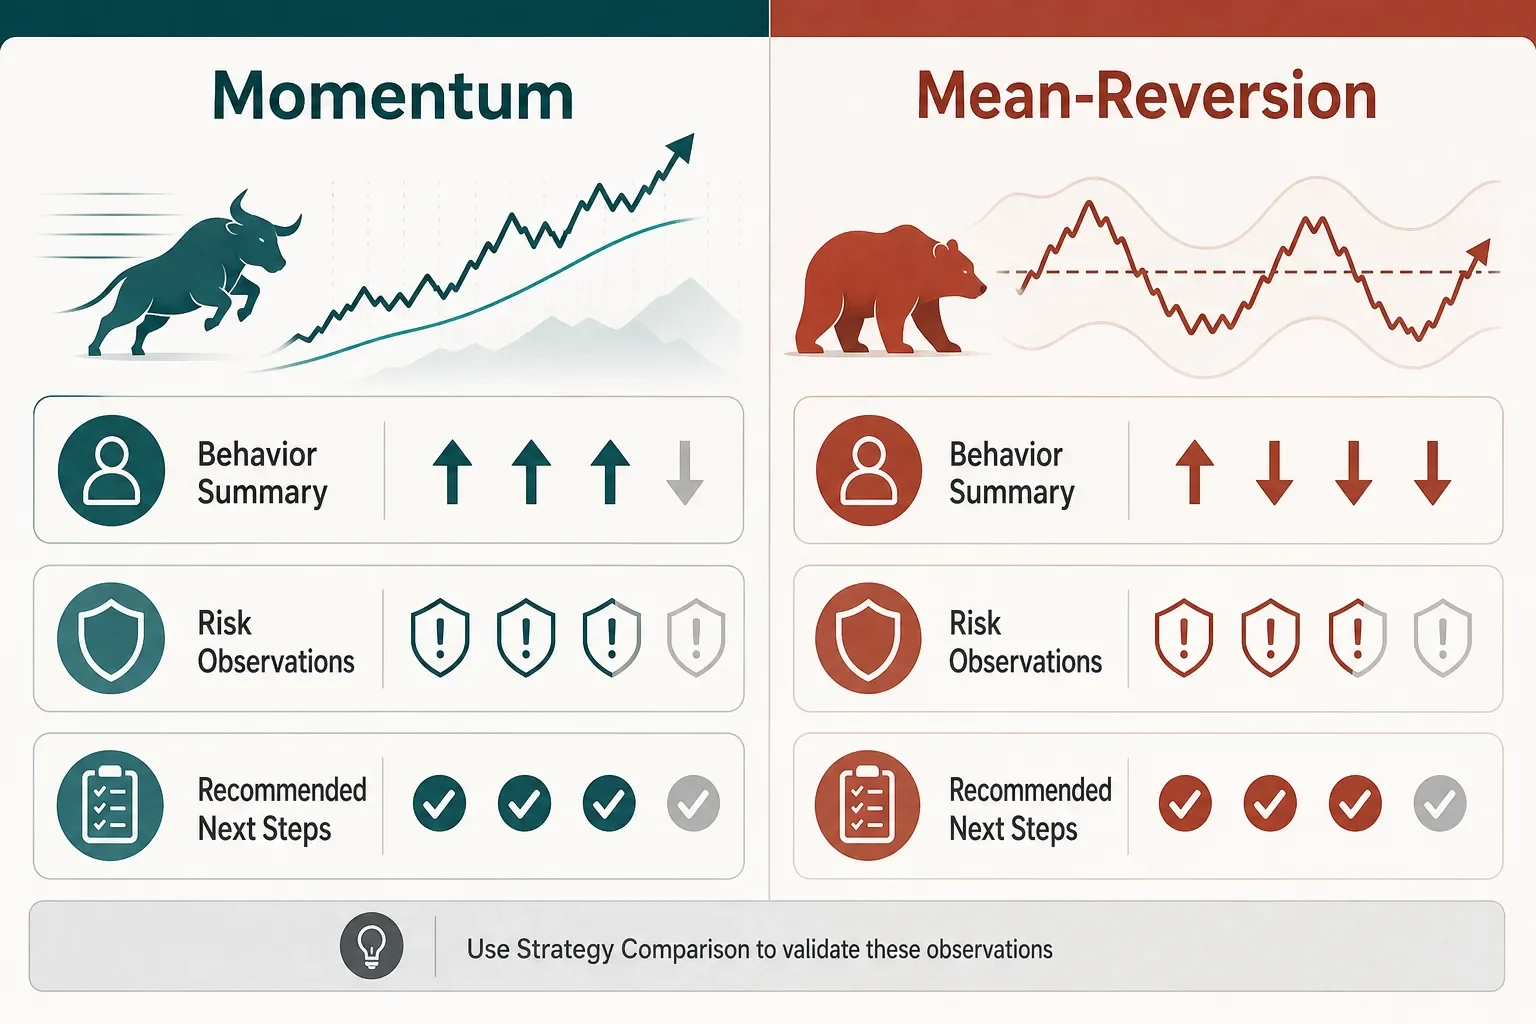
When Markets Decouple: A Trader’s Checklist for Post‑Event Strategy Reviews
A step‑by‑step playbook for post‑event reviews: capture hypotheses, tag trades by catalyst, log outcomes, and use Strategy Comparison to see what held up during the Korea chip crash vs. Bitcoin rally.
 2026-08-11
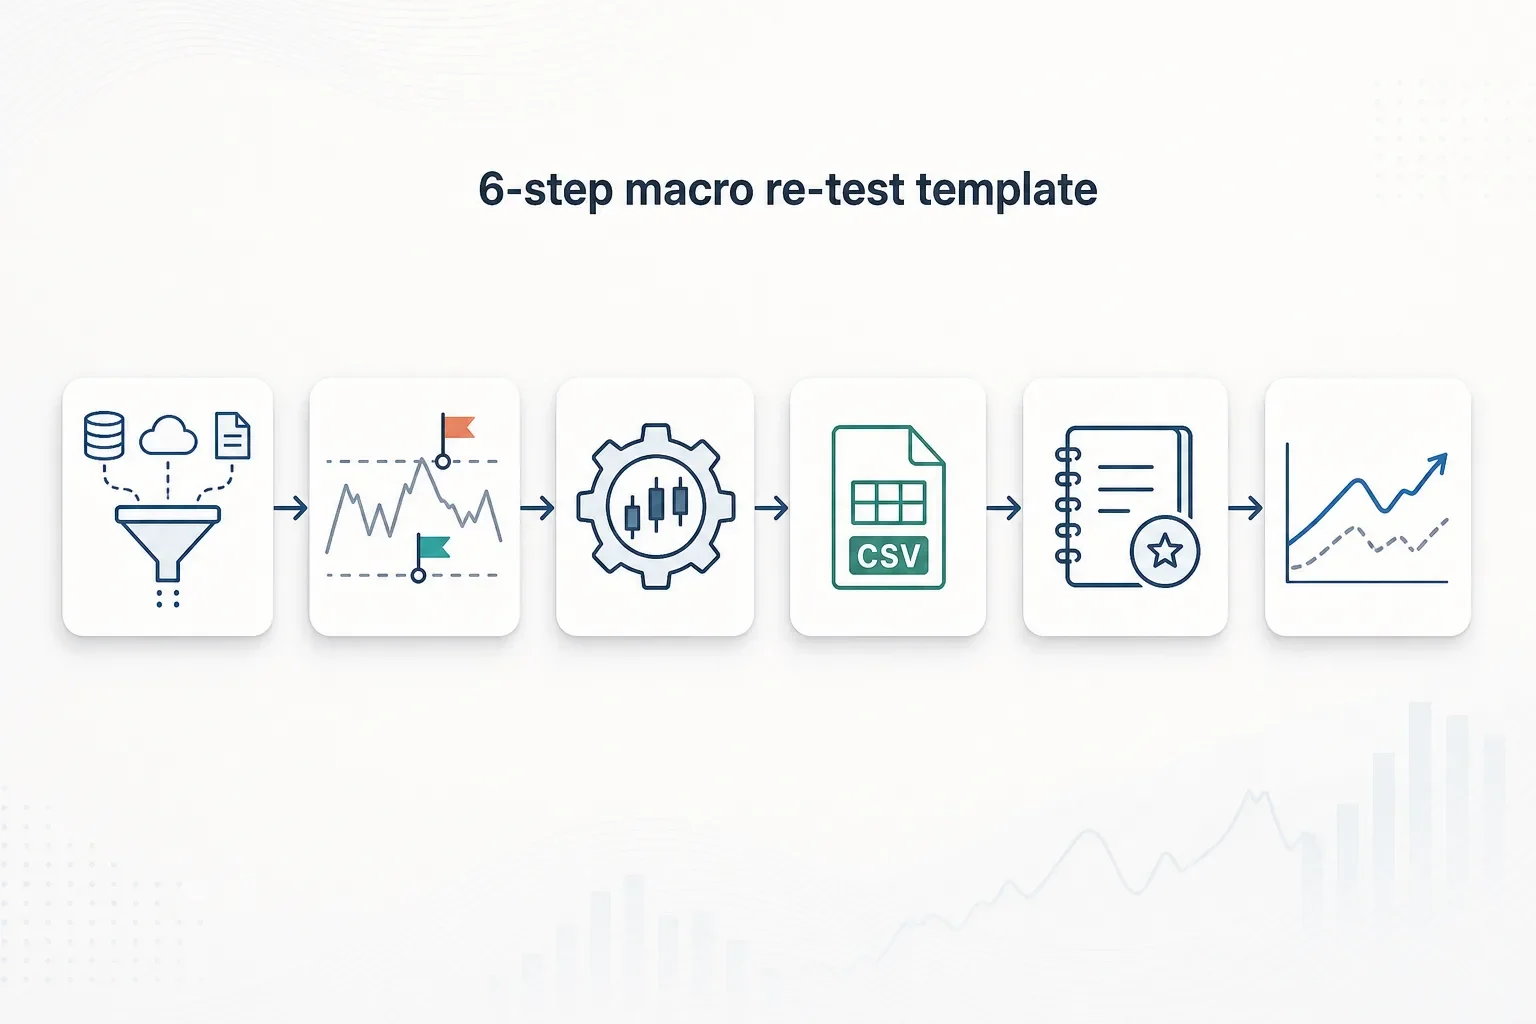
How to Backtest Crypto Strategies Against Rising Rates and Oil Shocks — A Practical Template
A hands-on template for re-testing crypto strategies when rates and oil spike: ingest macro time series, run variant backtests, record results in Trade Strategy, and compare outcomes to adapt sizing rules.
 2026-08-11
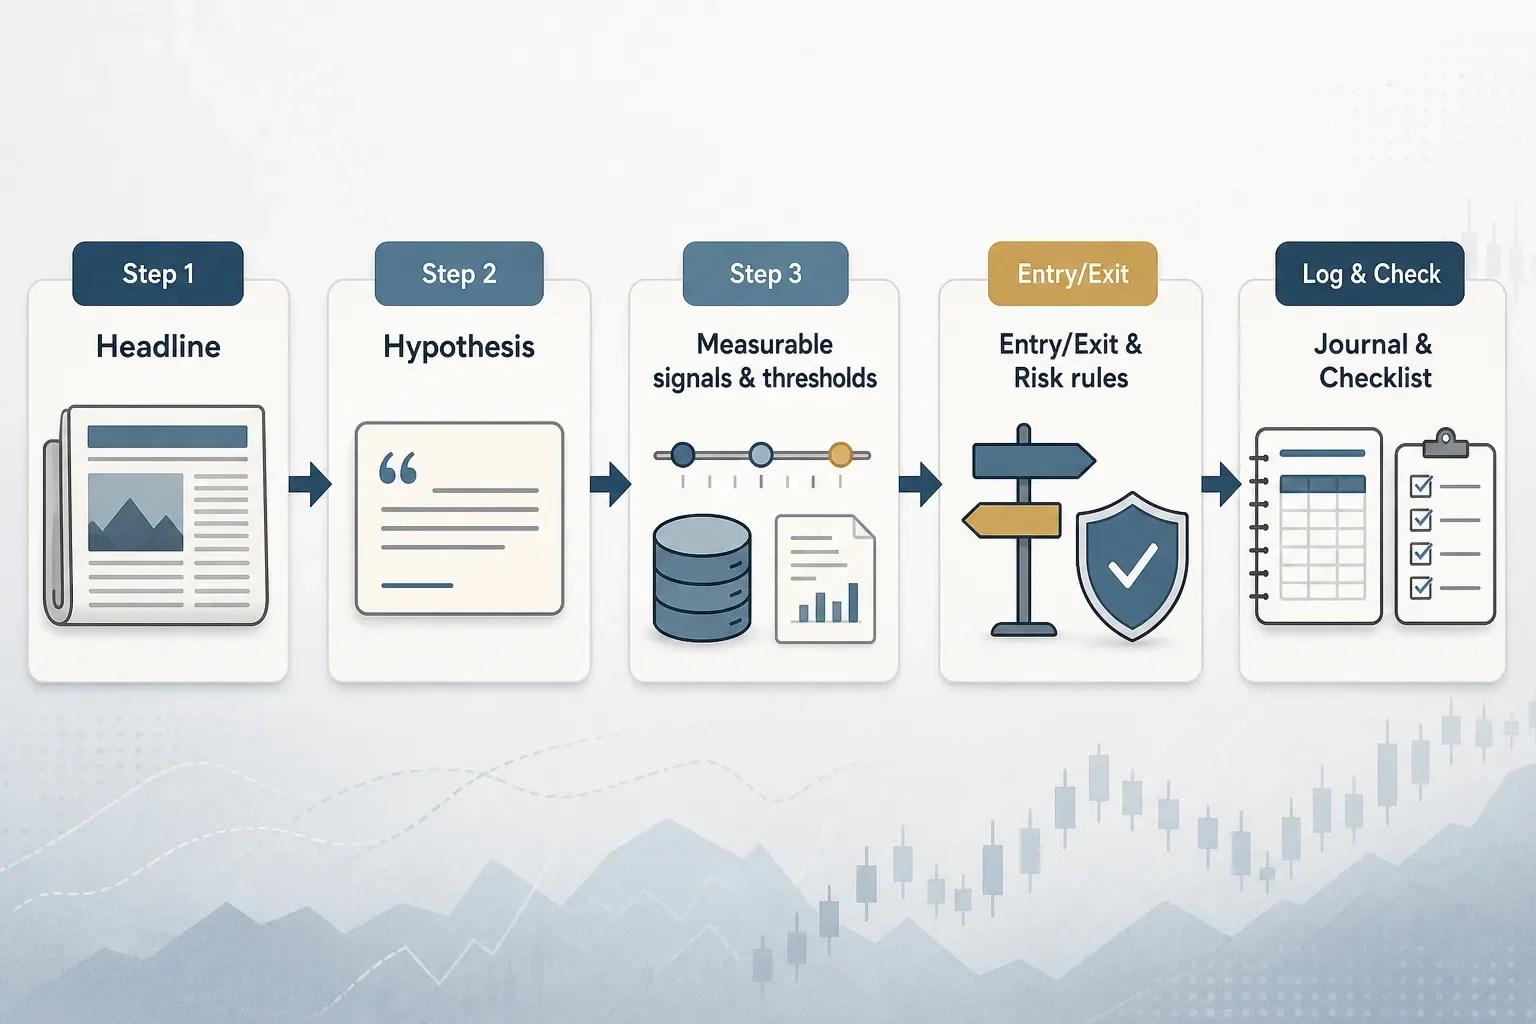
How to Turn BTC ETF Inflows and ETH Outflows into Testable Trade Hypotheses
A step-by-step guide for turning BTC ETF inflow and ETH outflow headlines into measurable trade hypotheses, with a practical template and checklist to log, test and iterate.