
How ETF Flows and Geopolitics Move Bitcoin - Quantifying the Effect for Strategy Builders
A practical walkthrough for traders: combine manual news annotations with Trade Strategy’s released tools to quantify whether ETF flows or geopolitical headlines caused BTC drawdowns. Includes a post-mortem template and demo dataset.
# How ETF Flows and Geopolitics Move Bitcoin - Quantifying the Effect for Strategy Builders
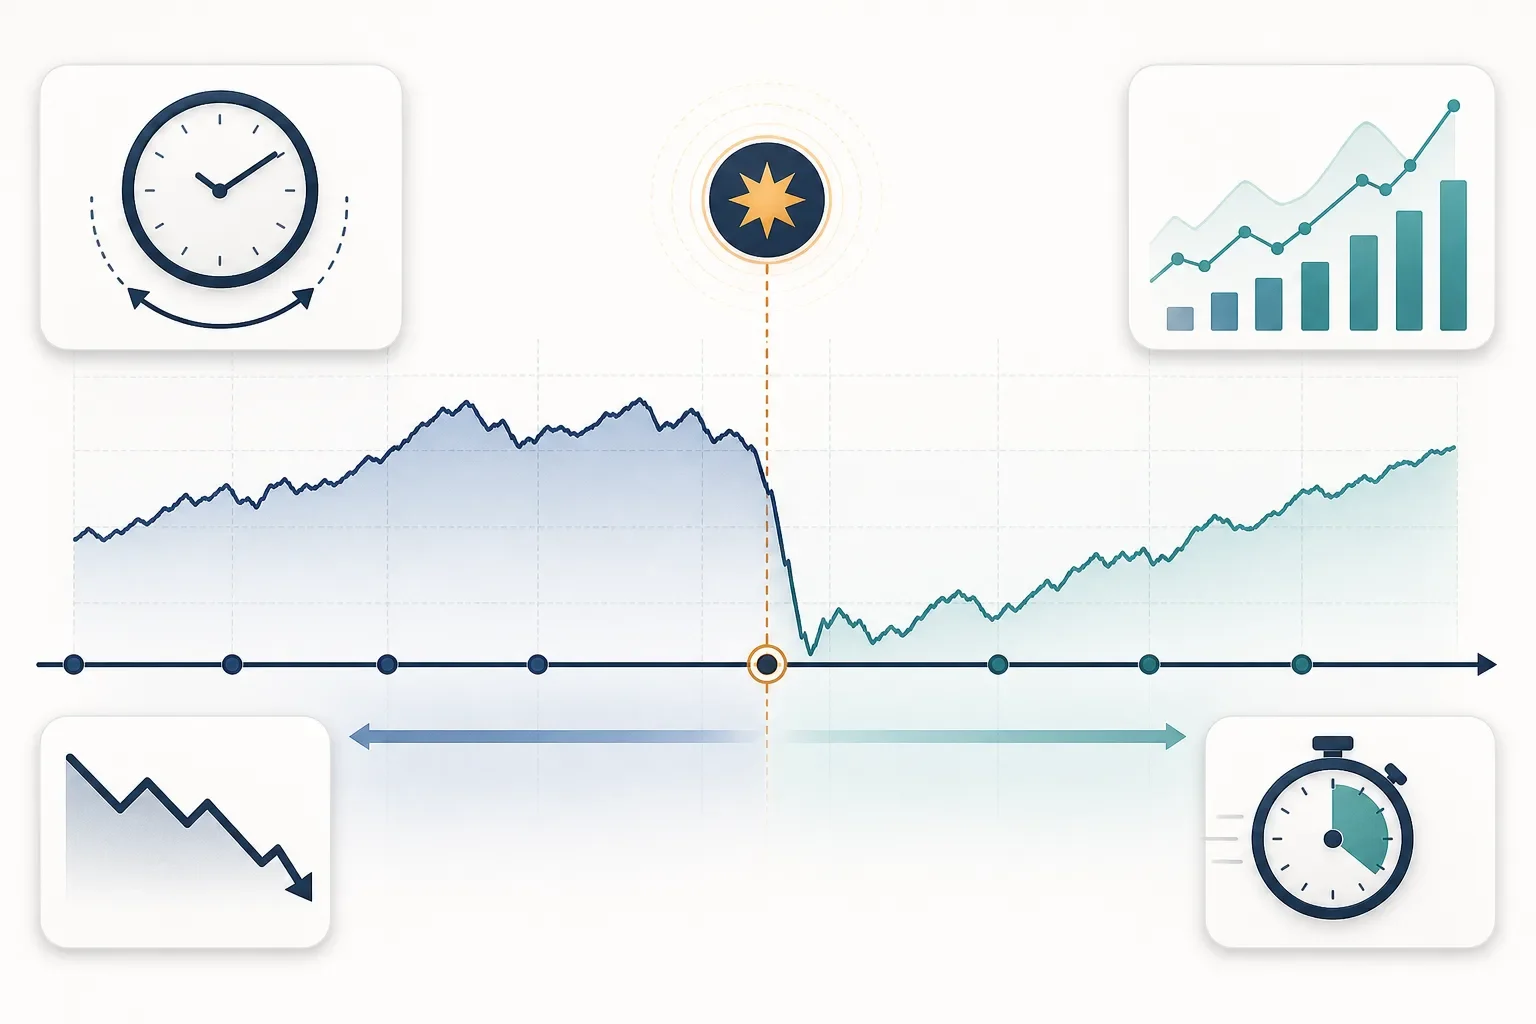
Five days of ETF inflows didn’t stop BTC from pulling back on geopolitical headlines. For strategy developers this is a familiar and frustrating pattern: structural flows push price in one direction while news-driven volatility triggers abrupt reversals. This walkthrough shows a practical, data-driven process for attributing drawdowns to ETF flows versus news shocks using manual event annotations and Trade Strategy’s released tools.
## Introduction
Attribution matters for active traders and strategy builders. Knowing whether a drawdown came from structural flows or a news shock changes the response: tighten risk controls, pause rebalancing, or reassess position sizing. You don’t need perfect certainty just a repeatable process that turns observations into defensible changes to strategy rules and risk assumptions.
This article provides a post-mortem template and a demo dataset you can apply to the Coindesk episode where bitcoin pulled back amid geopolitical headlines despite several days of ETF inflows. Download the demo dataset and the template from our blog: https://trade-strategy.com/blog
## Data you’ll need
- Minute or hourly BTC price series around the episode
- ETF flow data (time-stamped inflow/outflow totals per fund or aggregated daily/weekly) for the same window
- Timestamped news headlines or the time the market reacted (ideally with short annotations)
- Your strategy trade log (entries/exits, sizes) and P&L by timestamp
You can store the last two items inside Trade Strategy: create and document the strategy in Strategy Management and record time-stamped performance and notes in the Historical Results Journal. Use Strategy Comparison to evaluate performance across multiple variants after annotation.
## Step 1 - Create a reproducible event study window
1. Define the event time(s): the timestamp of the headline(s) and the ETF flow reporting windows.
2. Choose symmetric pre/post windows (e.g., 24–72 hours) to capture immediate reactions and short-lived reversals.
3. Record these windows in the Historical Results Journal as notes attached to affected runs so every future run includes the same standardized annotation.
Why this helps: a consistent window lets you compare apples-to-apples. Save the annotation to the strategy entry so it appears when you compare runs later.
## Step 2 - Compute candidate metrics
For each run or trade that overlaps the event windows, compute:
- Return during window (absolute and relative to pre-event baseline)
- Intraday realized volatility (e.g., standard deviation of returns in-window)
- Maximum drawdown during the window
- Time-weighted exposure (how long you were exposed during the shock)
These are simple metrics you can add to your Historical Results Journal entries as structured fields or in free-text notes that the team agrees on.
## Step 3 - Two complementary attribution checks
A. Time alignment check (did P&L move when the headline hit?)
- Plot P&L, price and ETF flows on the same timeline.
- If a large proportion of the drawdown occurs within a narrow band around the news timestamp and before large reported flows settle, that points to a news-driven shock.
B. Flow correlation check (did flows lead or follow price?)
- Compare price change direction to aggregate ETF inflow sign across the same or preceding windows.
- If strong inflows coincide with price drops, consider whether flows are lagging or being overwhelmed by headline volatility.
Neither check proves causality alone. Use both together and document your judgment in Trade Strategy’s Historical Results Journal so the rationale is preserved.
## Practical example (worked through, no guarantees)
Imagine a strategy that was long BTC and recorded a 6% drawdown in a 48-hour window. The timeline shows:
- Day 0: five straight days of net inflows reported in the ETF flow dataset.
- Hour 0: a geopolitical headline is published; BTC drops 4% in the first three hours.
- Hours 4–24: price recovers 1% but remains below pre-event level; ETF flows data for Day 1 still show net inflows.
Interpretation steps:
1. Time alignment suggests the largest move coincided with the headline (news-driven initial shock).
2. The continued net inflows indicate structural buying pressure, which may have limited the recovery or speeded mean reversion later.
3. Document in the Journal: "Initial drawdown concentrated in Hour 0–3; ETF inflows reported Day 1 did not prevent the headline-driven drop; exposure and stop rules need checking for headline-induced spikes."
Then run a Strategy Comparison across a variant that reduces intraday exposure around major headlines and one that doesn’t. Compare max drawdown and time-to-recovery in the annotated windows.
## Post-mortem template (step-by-step)
1. Event summary: date/time, headline summary, ETF flow notes.
2. Affected runs: strategy name/version, trade IDs, exposure during window.
3. Key metrics: return in-window, realized vol, max drawdown, time to recovery.
4. Attribution judgment: news-driven / flow-dominated / mixed (brief reasoning).
5. Action items: parameter changes, monitoring rules, re-test schedule.
6. Ownership: who updates the strategy, who verifies data and reruns comparisons.
Save this template as a checklist in your team playbook and paste completed versions into the Historical Results Journal entries for the affected runs.
## Tips to make this repeatable
- Standardize your event windows and annotation text so Strategy Comparison can filter runs reliably.
- Record both qualitative notes (headline text) and quantitative markers (inflow amount, timestamp).
- When possible, compare multiple strategies side-by-side to see which rule sets handled the episode best.
## What Trade Strategy helps you do today
- Strategy Management: create and document strategy rules and assumptions so the why/when of each trade is preserved.
- Historical Results Journal: attach time-stamped performance entries and qualitative notes about headlines and flows for reproducible post-mortems.
- Strategy Comparison: compare annotated runs to see which variants reduced drawdowns during news and flow episodes.
Note: the product roadmap includes planned AI-assisted BTC market analysis and probabilistic direction suggestions as decision support; these are planned features and not described here as available functionality.
## Conclusion
ETF flows and geopolitical headlines can push Bitcoin in opposite directions over the same multi-day window. The difference between an explainable one-off shock and a structural regime change is often subtle—but measurable. Build a simple, repeatable post-mortem: standardize event windows, annotate runs in your Historical Results Journal, compute a small set of metrics, and use Strategy Comparison to validate any rule changes.
## Call to action
Read the full walkthrough and download the demo dataset and post-mortem template from our blog: https://trade-strategy.com/blog
 2026-08-11
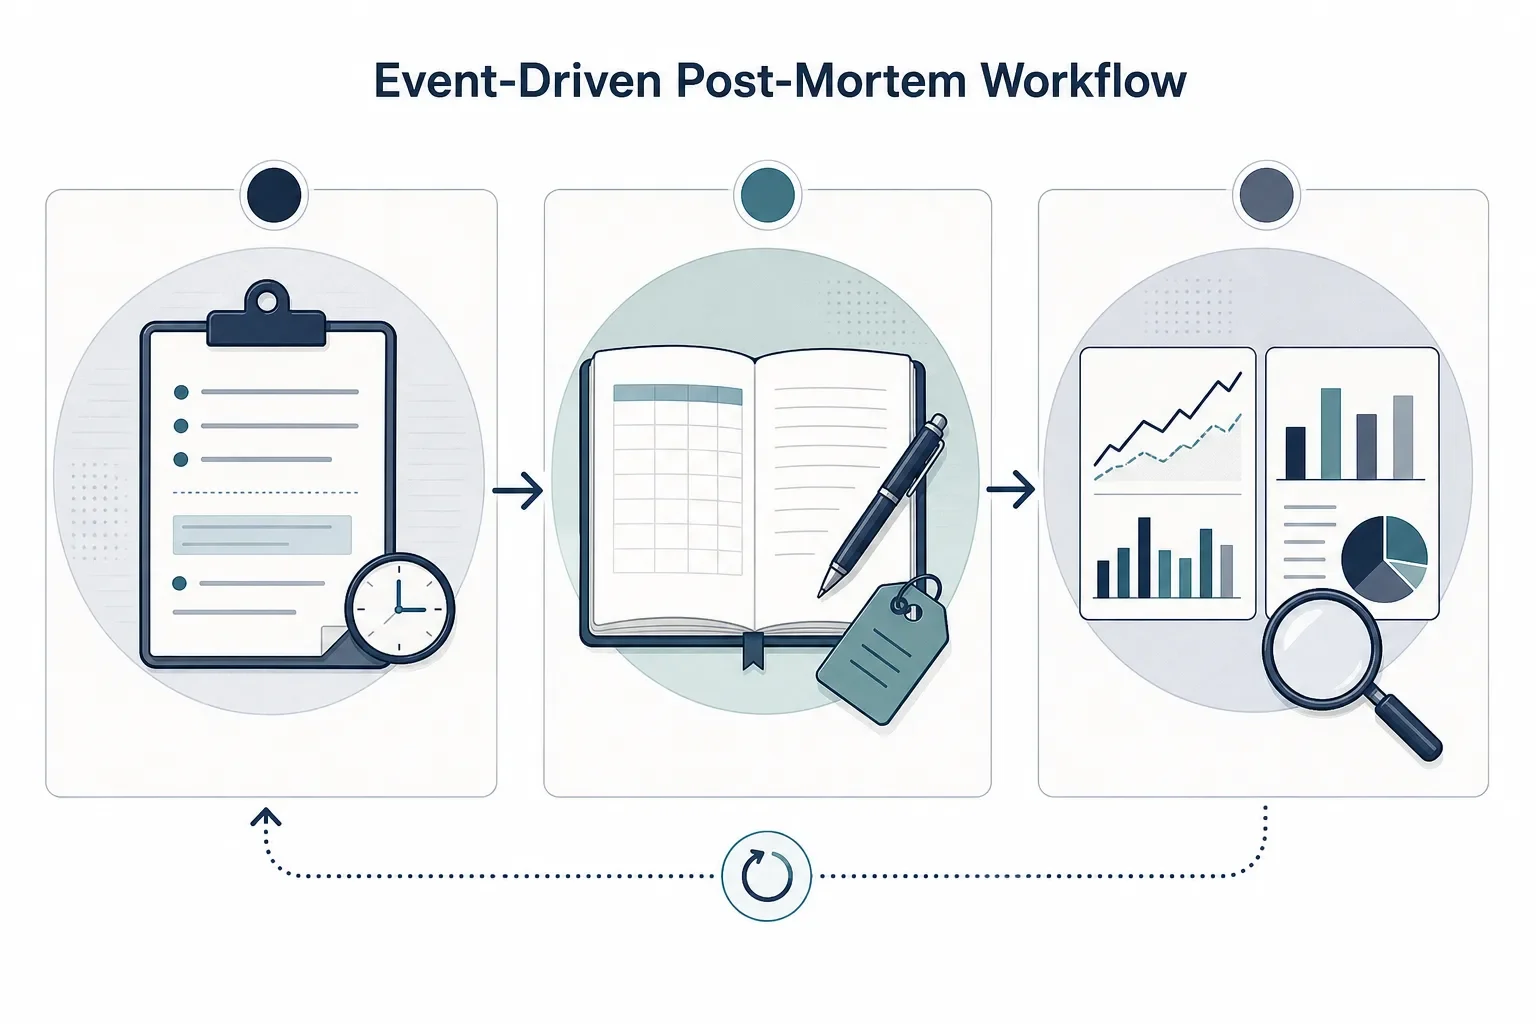
How to run an event-driven post‑mortem for your BTC strategy (step‑by‑step)
A step‑by‑step workflow for BTC event‑driven post‑mortems: record rules, log trades, compare pre/event/post windows using Trade Strategy to identify rule breakpoints and create testable updates.
 2026-08-11
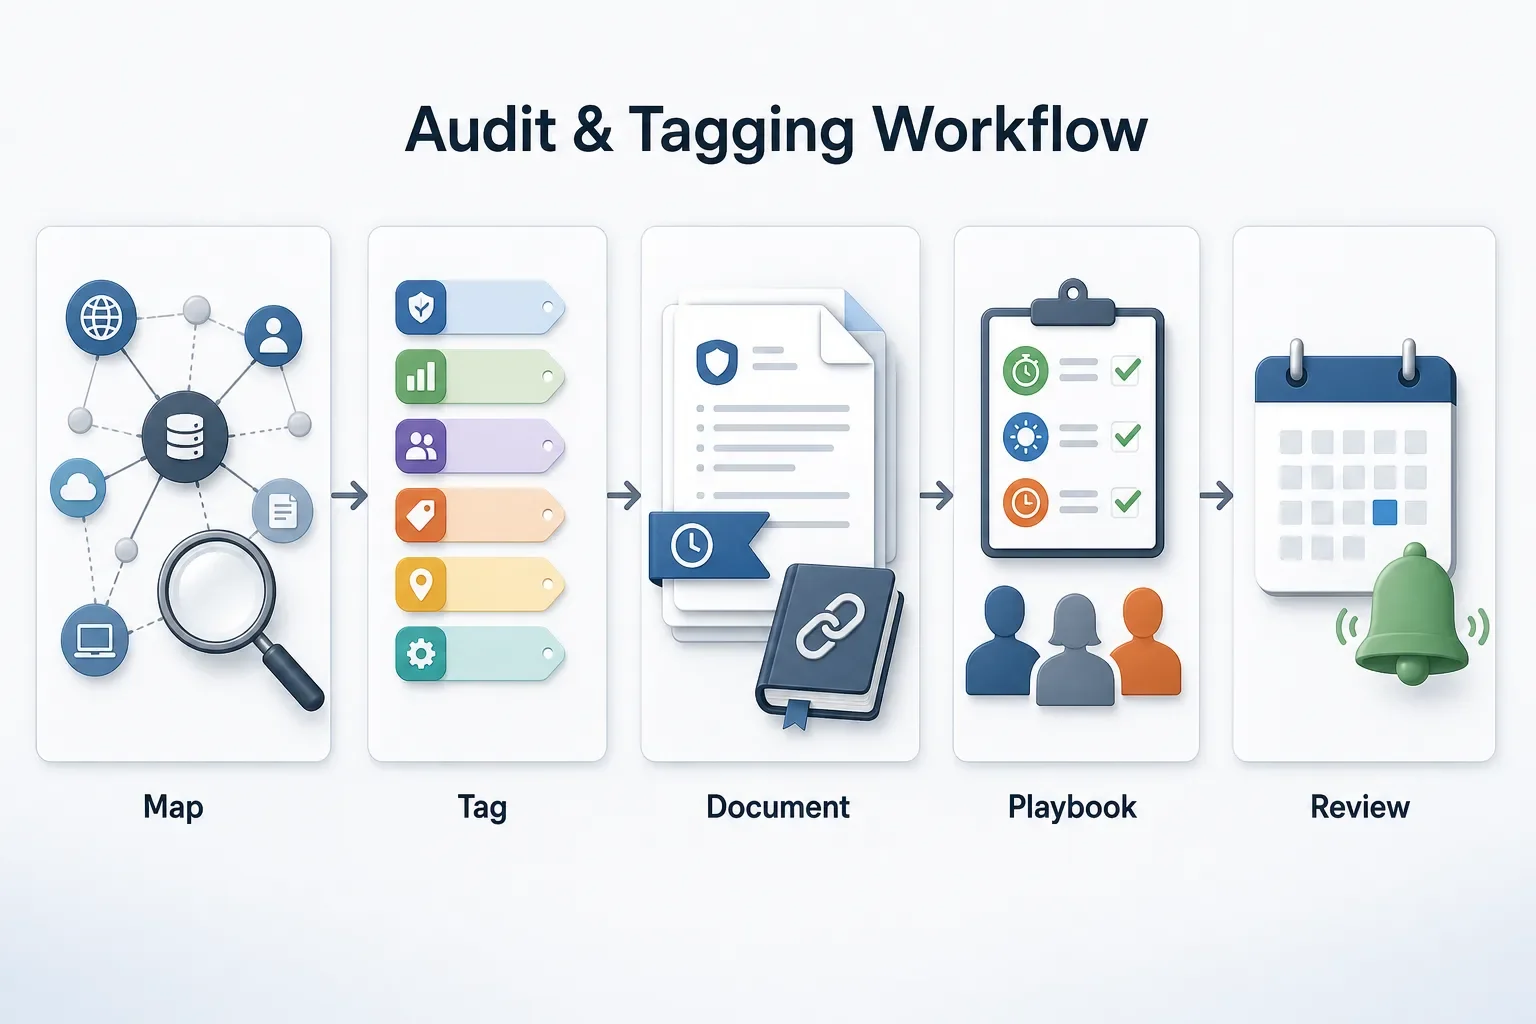
How to Audit and Tag DeFi Strategies for Regulatory Exposure
Practical, step‑by‑step workflow to map DeFi protocol touchpoints, tag regulatory exposure, preserve audit trails with documented rules and historical results, and prepare playbooks to respond quickly to enforcement events.
 2026-08-11
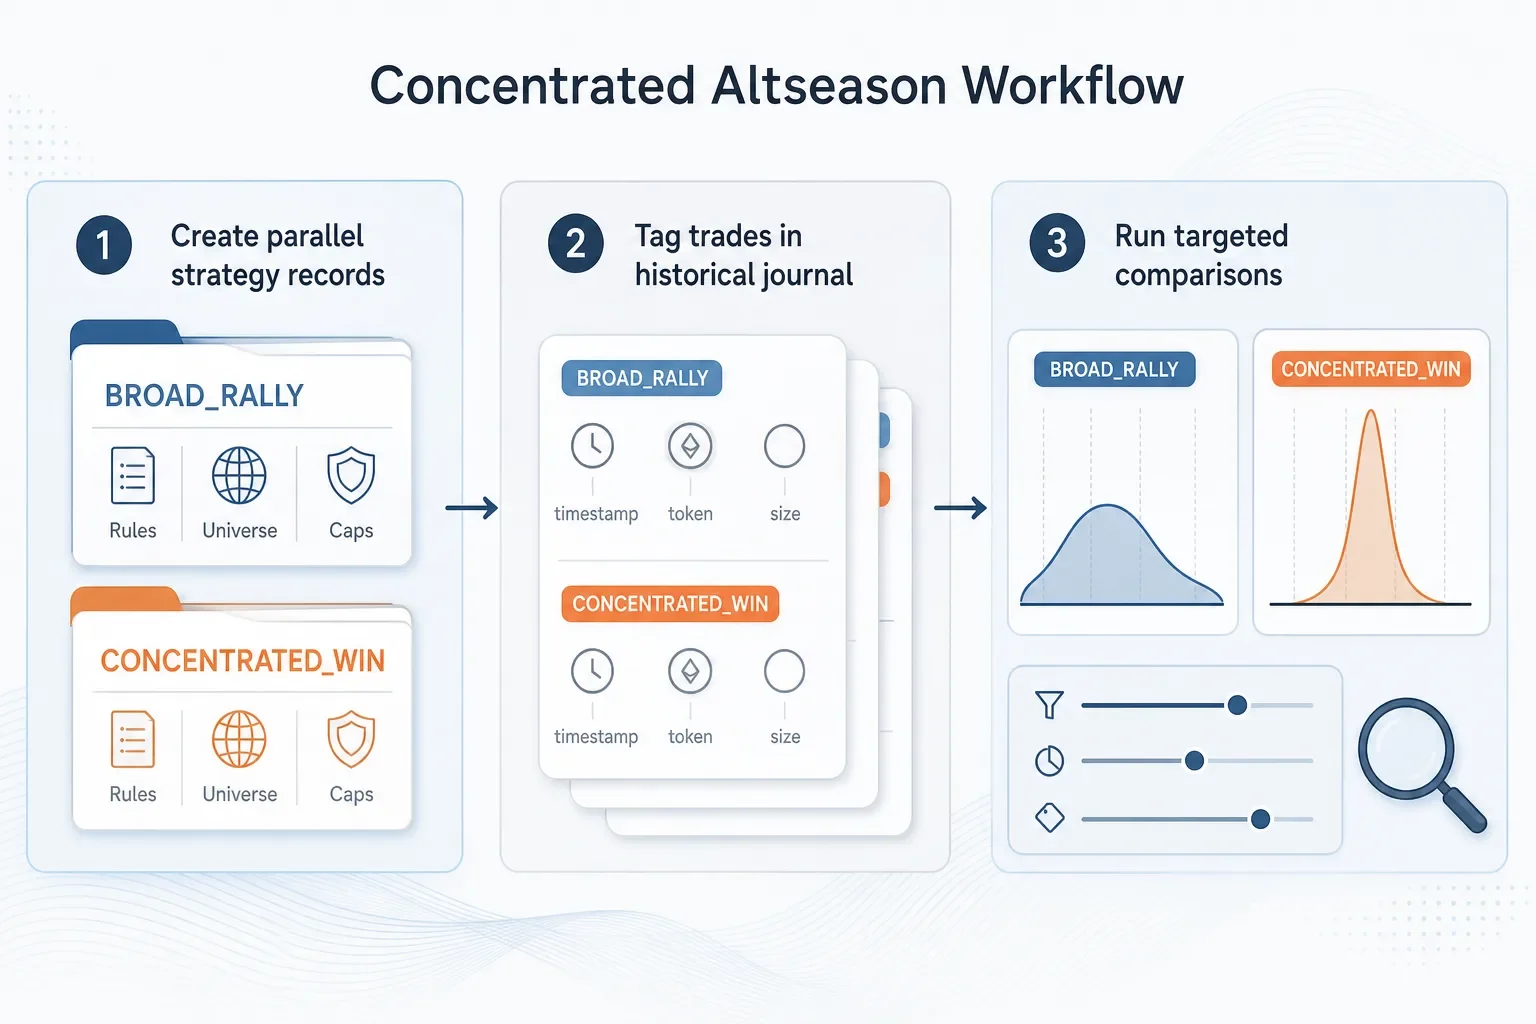
How to Adapt Your Strategies for a More Concentrated Altseason
Step-by-step workflow to adapt trading strategies for a concentrated altseason: create regime-specific strategy records, tag outcomes in a historical journal, compare results across token subsets, and apply concentration-aware sizing and monitoring.