
Backtesting Bitcoin event-driven strategies: a practical Trade Strategy workflow
Turn headlines into testable BTC strategies: a step-by-step workflow to ingest event timestamps, tag events, measure pre/post volatility and correlation, and document results using Trade Strategy.

# Backtesting Bitcoin event-driven strategies: a practical Trade Strategy workflow
Bitcoin recently climbed to a multi-week high while equities largely ignored geopolitical and tariff headlines. For systematic traders this raises a familiar question: which headlines move crypto, and how do those moves change volatility and correlation with equities? This guide shows a reproducible, product-led workflow for turning headlines into testable hypotheses and documented results using Trade Strategy.
## Why event-driven trading for Bitcoin matters
Event-driven trading tests whether price reactions to news—geopolitical shocks, tariff announcements, major policy moves—are predictable and exploitable when framed as rules. The core challenges are clear:
- Detecting and timestamping the headlines that matter.
- Measuring pre/post-event shifts in volatility and cross-asset correlation (BTC vs equities).
- Backtesting strategies across many events and regimes, and making results reproducible.
Trade Strategy helps with the organization and documentation steps: create strategy definitions, record historical results, and compare tagged strategies across event types and regimes. The platform is decision-support for strategy development and evaluation; it does not execute trades.
## Overview of the workflow
High level steps:
1. Define hypotheses and strategy rules in Strategy Management.
2. Gather headline timestamps (CSV or feed) and standardize event tags.
3. Run backtests or generate trade signals externally (or from exchange logs) and format results for import.
4. Record trade outcomes and event tags in the Historical Results Journal.
5. Use Strategy Comparison to evaluate performance by event type and regime.
6. Iterate and document assumptions so tests are reproducible.
Below is a practical, repeatable implementation of each step.
## Step 1 — Form a clear hypothesis and rules
Start with a concise, testable hypothesis. Example:
- Hypothesis: "After sudden geopolitical headlines, BTC shows a short-term volatility spike and a temporary decoupling from US equities; a volatility-targeted mean-reversion entry 1–4 hours after the headline offers an edge."
Translate this to rules you record in Trade Strategy’s Strategy Management feature:
- Trigger: headline classified as Geopolitical or Tariff.
- Entry rule: wait 1 hour, then enter mean-reversion if 30-minute realized vol > X and BTC has moved > Y% from pre-event baseline.
- Exit: fixed time-based exit or volatility reversion.
- Risk rules and sizing assumptions.
Document assumptions and parameter ranges in Strategy Management so the strategy definition is explicit and reproducible.
## Step 2 — Ingest headlines and timestamps
Create a standard CSV for event timestamps and tags. Keep columns simple and consistent:
- event_id, timestamp_utc, source, headline, event_type, confidence
Example row:
- 2026-06-XXT14:22:00Z, Cointelegraph, "Iran strikes reported", Geopolitical, 0.8
You can ingest this CSV or a feed into your preprocessing pipeline. The goal is to attach a canonical event_id and event_type to every timestamp you test. Save the CSV and include its schema in your experiment notes so others can reproduce the ingestion.
## Step 3 — Measure pre/post volatility and correlation (external calculation)
Trade Strategy currently focuses on strategy documentation and result tracking. For numeric pre/post analysis, run reproducible scripts (Python/pandas) to compute realized volatility and cross-asset correlation over defined windows. Example pseudocode:
```python
# load OHLCV for BTC and an equities index
# compute log returns, rolling std (realized vol), and rolling correlation
pre_vol = returns['BTC'].rolling(window=30).std() # 30 periods before event
post_vol = returns['BTC'].rolling(window=30).std().shift(-post_offset)
corr_pre = returns['BTC'].rolling(window=60).corr(returns['SPX'])
```
Store the output metrics keyed to event_id. Typical metrics to record:
- pre_event_vol, post_event_vol, vol_change_pct
- pre_event_corr, post_event_corr, corr_change
- peak_move_pct in X minutes
Save these metrics to CSV so they can be imported into Trade Strategy's Historical Results Journal or attached to strategy notes.
## Step 4 — Run backtests and prepare result logs
You can run backtests in your preferred engine (backtesting library, broker logs, or custom code). Export trade logs with a consistent schema so results can be linked to event_id:
- trade_id, event_id, strategy_id, entry_time, exit_time, entry_price, exit_price, pnl, position_size, notes
Import or copy these records into Trade Strategy’s Historical Results Journal. The Journal is where you record actual outcomes and observations tied to your documented strategy rules.
Important: include the event_type tag and regime metadata (e.g., time-of-day, volatility regime) for each trade so later comparisons are apples-to-apples.
## Step 5 — Compare strategies and event buckets
With strategies defined in Strategy Management and results recorded in the Historical Results Journal, use Strategy Comparison to evaluate performance across tagged event types and regimes. Suggested comparisons:
- Performance after Geopolitical vs Tariff headlines.
- Short-term (1–6 hour) vs intraday (6–24 hour) outcomes.
- High-volatility regime vs low-volatility regime.
Focus comparisons on reproducible aggregates: average PnL per event, win rate, drawdown, and risk-adjusted metrics you compute externally. Store the comparison rationale and selection criteria in Strategy Management so peers can repeat the analysis.
## Practical example: tagging a single event
1. You ingest the Cointelegraph headline about "Iran strikes" with timestamp 2026-06-XXT14:22:00Z and tag event_type=Geopolitical.
2. Your script computes a 60-minute realized vol spike and a drop in BTC/SPX correlation for the next 4 hours.
3. Backtest engine shows multiple trades that meet your entry rule after this event—export these trades and import them into the Historical Results Journal with event_id linked.
4. Use Strategy Comparison to view aggregate performance for all Geopolitical-tagged trades and compare to Tariff-tagged trades.
This process lets you assess whether your hypothesis holds across many events, not just anecdotally.
## Document everything for reproducibility
Good experimental hygiene matters:
- Store the headline CSV, scripts used for metrics, backtest parameters, and the strategy definition together.
- In Strategy Management, version your strategy definitions when you change parameters.
- In the Historical Results Journal, keep notes about data sources and any manual adjustments.
Trade Strategy is built to help you centralize those definitions and results so your tests are easier to review and iterate.
## Roadmap note
Trade Strategy plans AI-assisted BTC market analysis as part of its product roadmap; this feature is described as upcoming and intended to offer multi-timeframe probabilistic analysis as decision support. It is not a guarantee of outcomes.
## Conclusion
Event-driven trading for Bitcoin is process-heavy: collect clean timestamps, measure pre/post shifts, run reproducible backtests, and centralize documentation. Use Strategy Management to define clear rules and assumptions, the Historical Results Journal to record outcomes linked to events, and Strategy Comparison to evaluate performance across event types and regimes. This structure turns headlines into testable, repeatable experiments and helps you iterate systematically.
Read the full walkthrough on our blog: https://trade-strategy.com/blog
 2026-08-11
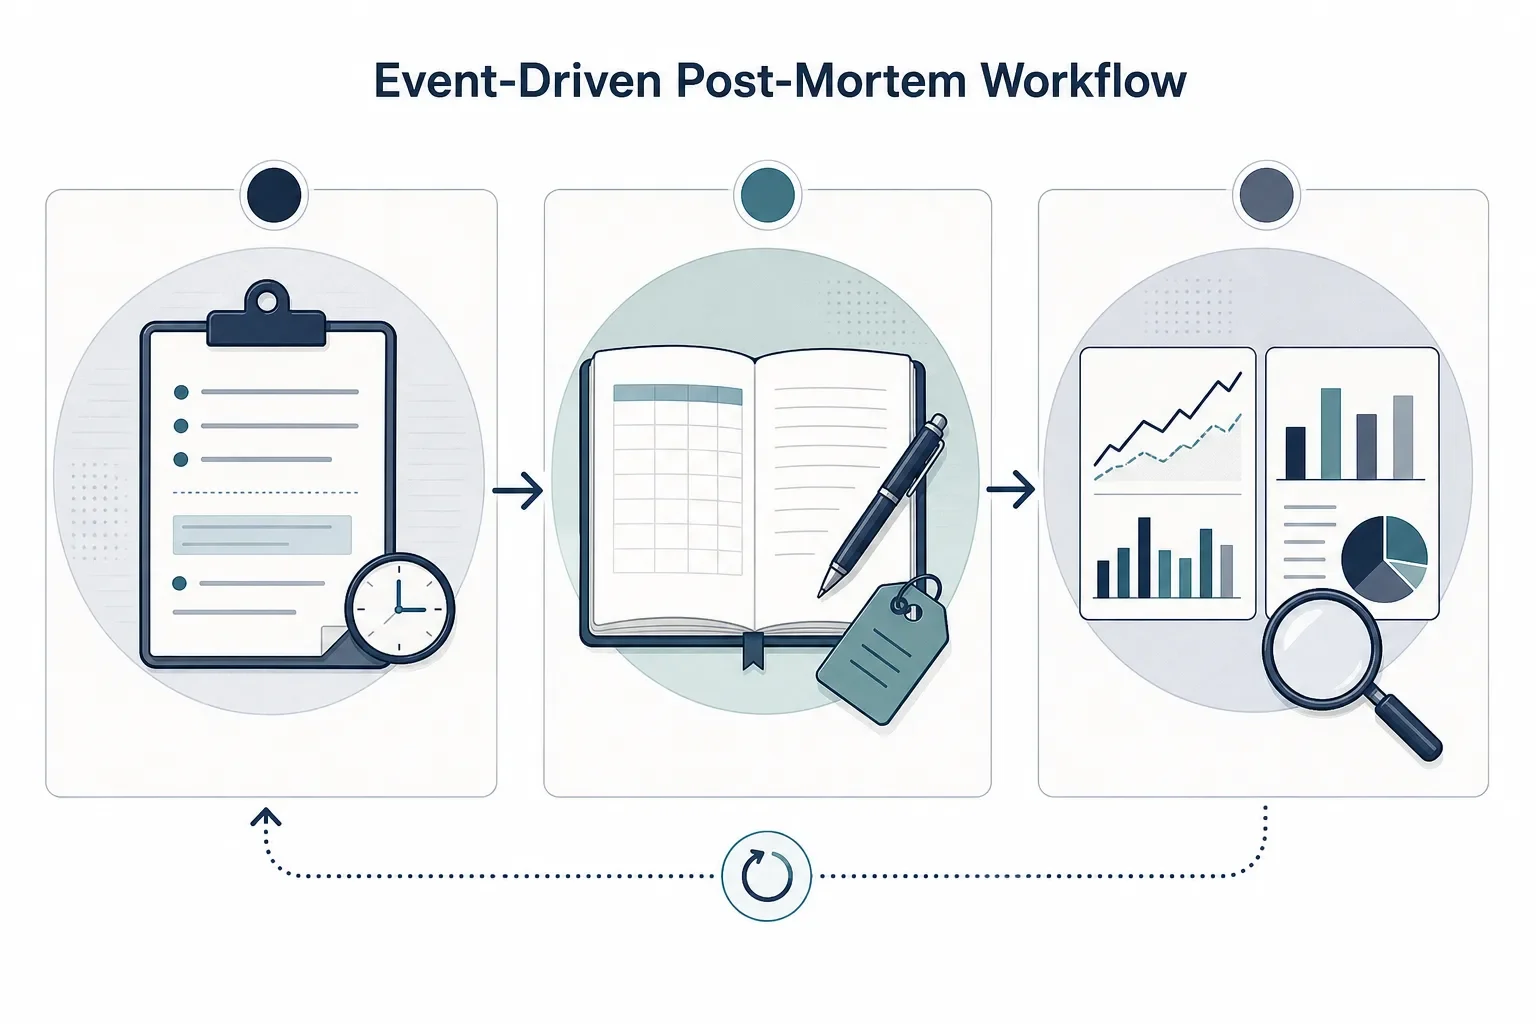
How to run an event-driven post‑mortem for your BTC strategy (step‑by‑step)
A step‑by‑step workflow for BTC event‑driven post‑mortems: record rules, log trades, compare pre/event/post windows using Trade Strategy to identify rule breakpoints and create testable updates.
 2026-08-11
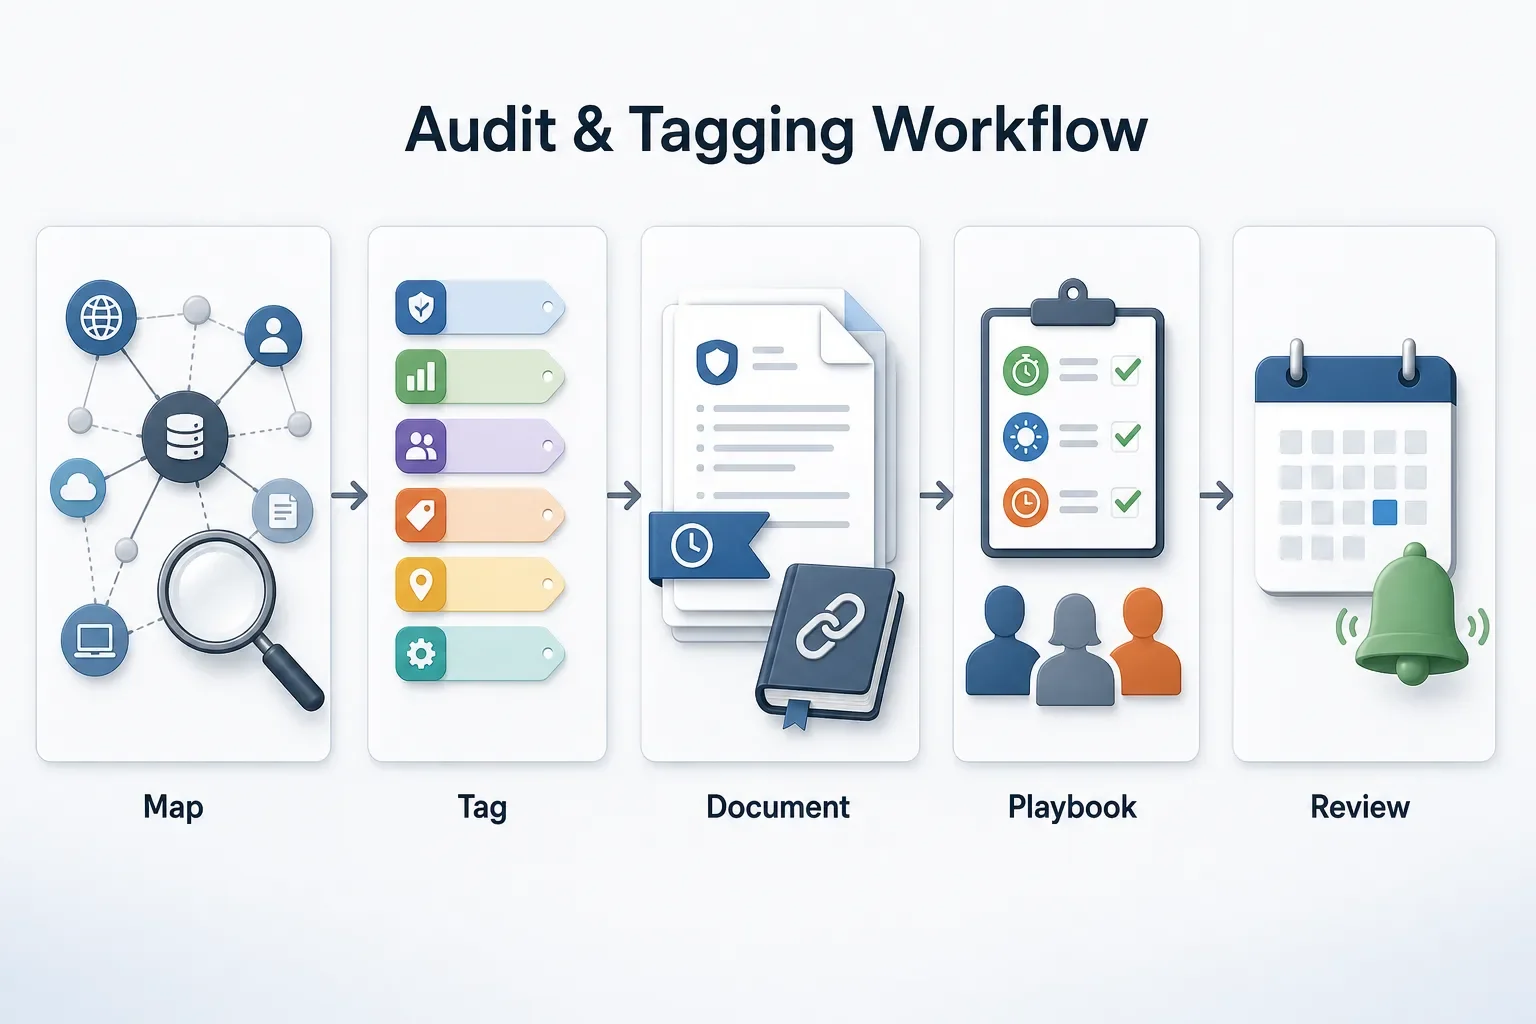
How to Audit and Tag DeFi Strategies for Regulatory Exposure
Practical, step‑by‑step workflow to map DeFi protocol touchpoints, tag regulatory exposure, preserve audit trails with documented rules and historical results, and prepare playbooks to respond quickly to enforcement events.
 2026-08-11
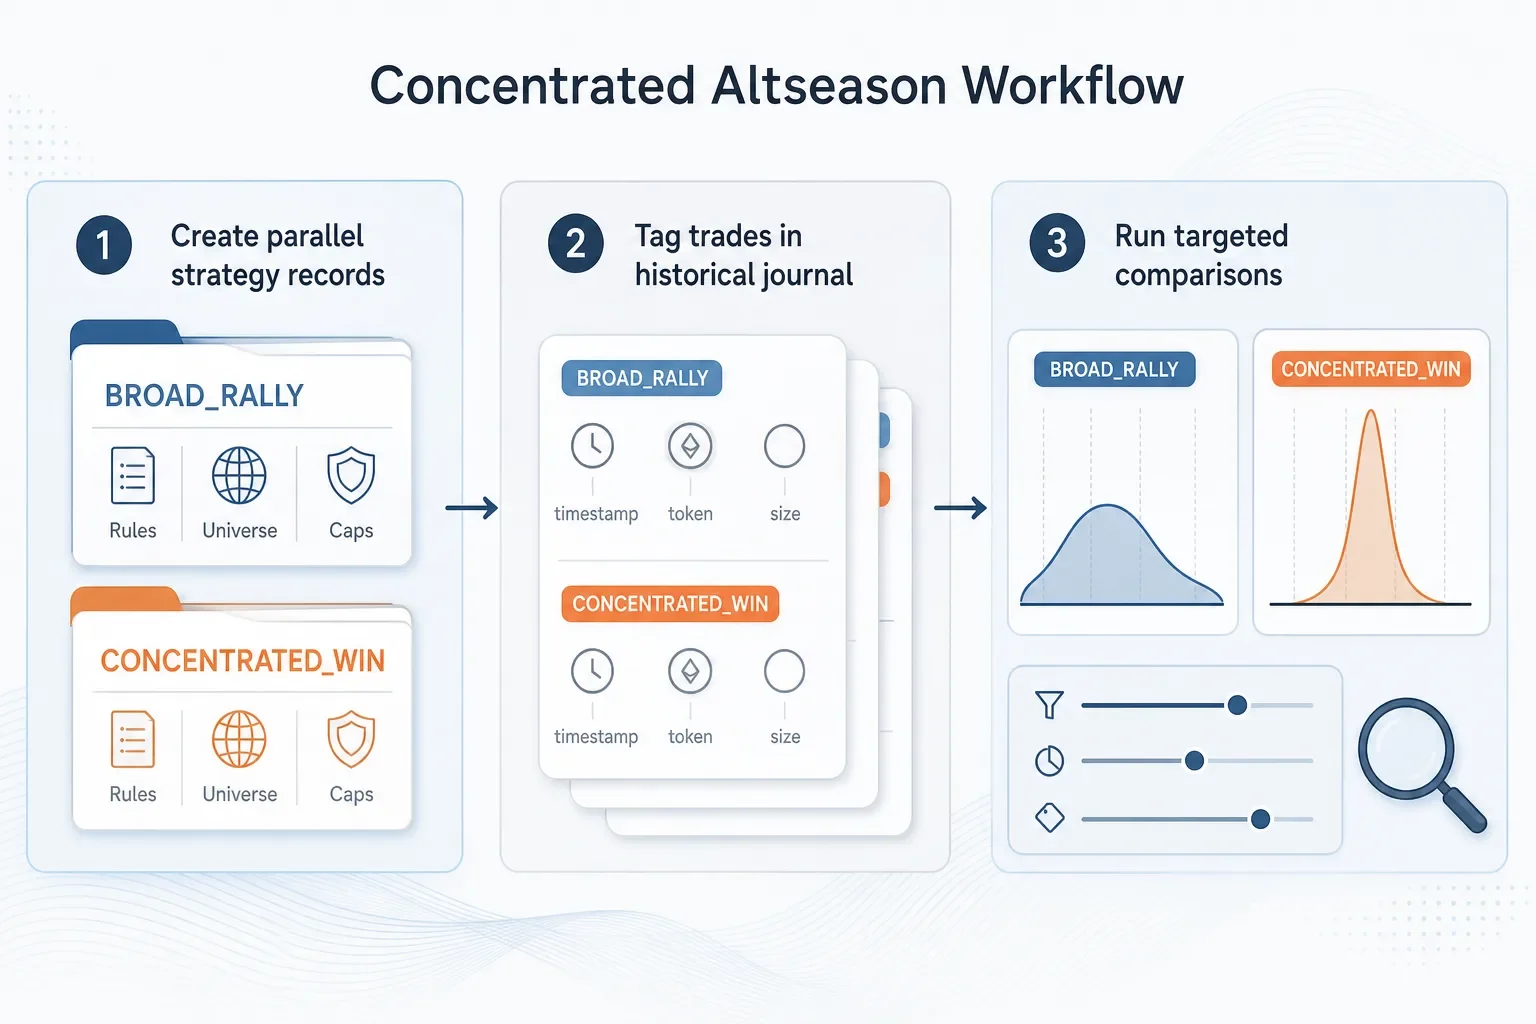
How to Adapt Your Strategies for a More Concentrated Altseason
Step-by-step workflow to adapt trading strategies for a concentrated altseason: create regime-specific strategy records, tag outcomes in a historical journal, compare results across token subsets, and apply concentration-aware sizing and monitoring.