
How the Nvidia ‘chip trade’ pushed Bitcoin higher — a trader’s checklist for attributing cross‑asset rallies
A step‑by‑step checklist for attributing a July BTC move to the Nvidia/chip trade using disciplined strategy documentation, event tagging and side‑by‑side comparison in Trade Strategy.
# How the Nvidia ‘chip trade’ pushed Bitcoin higher — a trader’s checklist for attributing cross‑asset rallies
When flows into semiconductor and tech stocks flip back into a risk‑on tailwind, crypto can follow. In late July, reports noted Bitcoin moved to a one‑month high (approx. $65–66k at the time; illustrative). For active traders and strategy teams, the essential question is not whether BTC moved but why — and how to prove the linkage rigorously.
This post is a step‑by‑step case study and practical checklist showing how disciplined strategy documentation, event tagging inside your results journal, and side‑by‑side strategy comparison help attribute a cross‑asset move. Wherever this post says “record” or “tag,” those are actions you can perform today in Trade Strategy using Strategy Management and the Historical Results Journal; use Strategy Comparison to test candidate explanations. At the end I include templates you can paste into your account.
## 1. Start with a clear hypothesis and documented strategy
### Write the attribution hypothesis
Before chasing correlations, write a short, falsifiable hypothesis. Example:
- Hypothesis: “A renewed chip/tech equity rally (Nvidia‑led) increases risk appetite and accounts for a material portion of recent BTC upside.”
Record this hypothesis in a Strategy entry using Trade Strategy’s Strategy Management. Capture the strategy rules and the assumption explicitly — e.g., what counts as a chip trade signal (NVDA > X% on a day, semiconductor index outperformance, etc.). Label any numeric thresholds you use as illustrative until you validate them.
### Why documentation matters
If you don’t record your assumptions you can’t test them cleanly. Strategy Management lets you store rules, timeframes and the assumptions you’ll test against the Historical Results Journal, which preserves the event‑level outcomes you need to compare later.
## 2. Build a disciplined results entry for event attribution
### Use a consistent results template
When the market moves, make a journal entry that separates market reaction from your trade performance. In the Historical Results Journal, use a structured entry that includes fields like:
- Date/time window
- Strategy name
- P&L change (absolute and %)
- Market move summary (BTC price change, S&P500/tech index change)
- Candidate catalyst (e.g., "Nvidia earnings beat — chip trade back")
- Confidence level in catalyst (low/medium/high)
- Notes and tags (regime: risk‑on)
Keeping this format for each event ensures later comparisons are apples‑to‑apples.
### Illustrative example (July rally):
- Date: late July
- Strategy: Momentum BTC spot
- P&L change: +3.4% (illustrative example)
- Market move (illustrative): BTC +4% intraday, NVDA +7%, SOX index +3%
- Candidate catalyst: chip/tech trade re‑acceleration
- Confidence: medium
Those are the pieces you store in the Historical Results Journal so that later you can quantify how often your strategy moves alongside tech flows.
## 3. Tag events and maintain a catalyst taxonomy
### Create a taxonomy you can search
A simple taxonomy might be: Macro (rates, CPI), Equities (chip/tech, megacap), On‑chain (whale flow, staking news), Regulation, Liquidity. Use the tags field in your journal entries and strategy notes to assign one or more tags to each recorded event. Normalize tag names (for example: "ChipTrade", "RiskOn", "OnChain") so filters return consistent results.
### How this helps attribution
With consistent tags you can filter journal entries to see all instances where a given tag coincided with a strategy P&L swing. That turns anecdote into data — you can count frequency and directionality of moves tied to each catalyst and build a repeatable view of when the hypothesis holds.
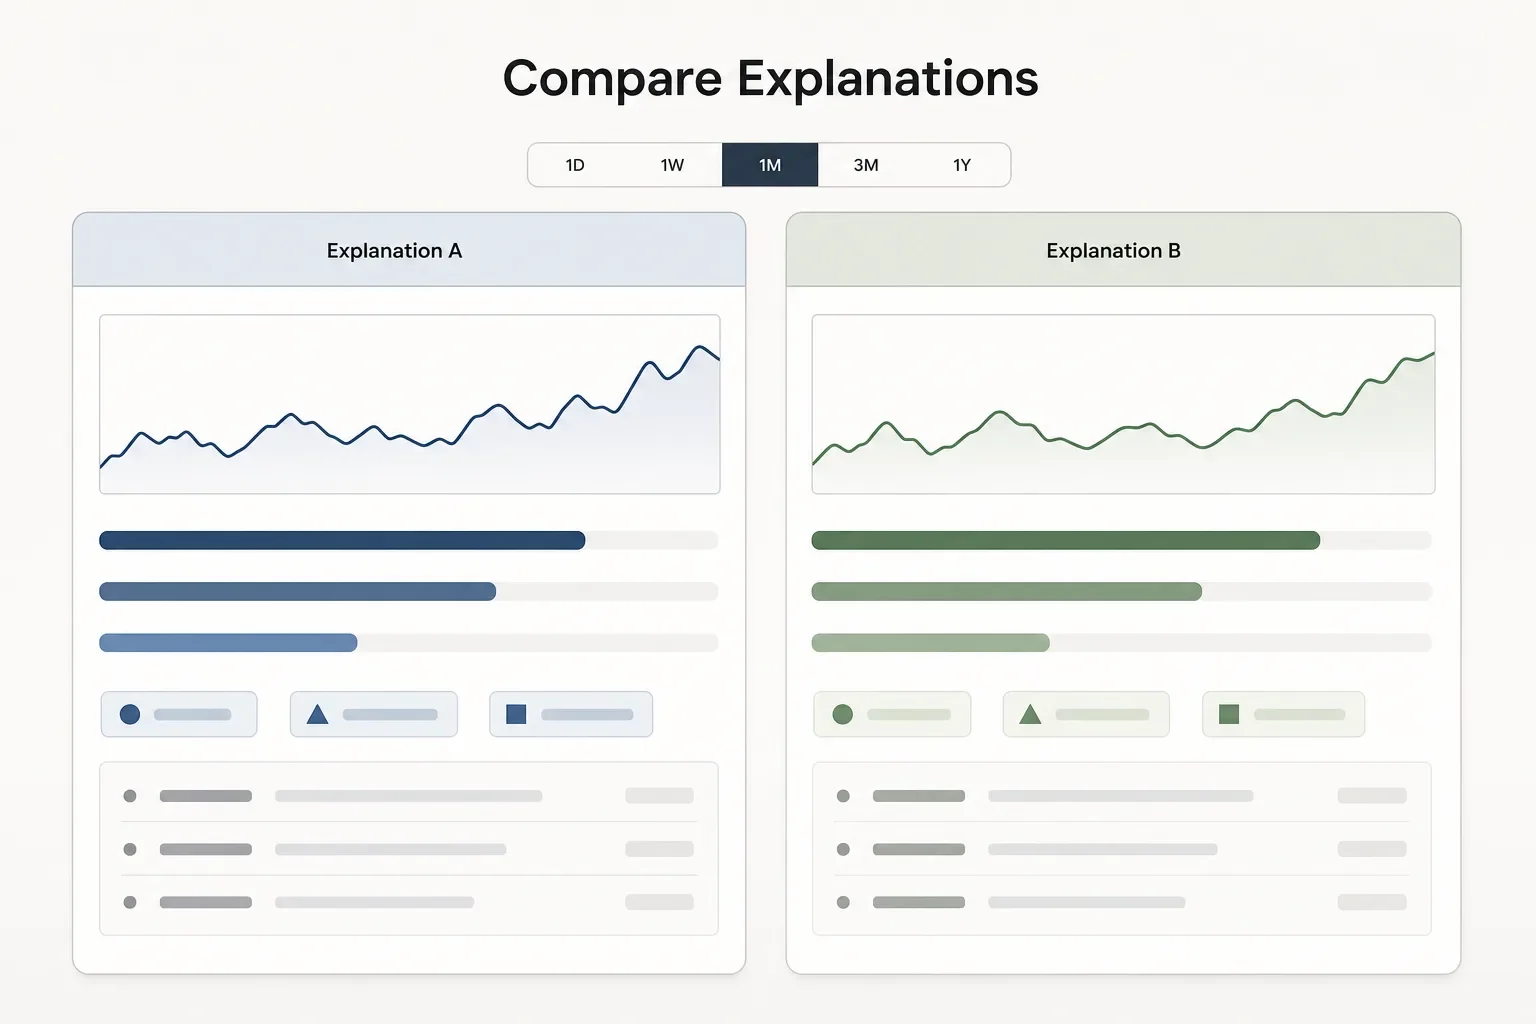
## 4. Compare candidate explanations with side‑by‑side strategy comparison
### Build competing explanations as strategies
Create two or more candidate “explanations” in Strategy Management — for example:
- Explanation A: BTC responds to chip/tech flows (risk‑on)
- Explanation B: BTC reacts to on‑chain liquidity events
Record historical outcomes for each explanation in the Historical Results Journal, then use Strategy Comparison to view them side‑by‑side across the same time windows.
### What to look for in the comparison
- Consistent directional alignment: BTC and the chip index moving together repeatedly during tagged windows.
- Frequency: how often a chip/tech tag appears near notable BTC moves.
- Magnitude: the typical scale of P&L changes in your strategy during correlated windows.
Strategy Comparison helps you avoid confirmation bias by forcing structured comparison of saved hypotheses and results. It’s a documentation and analysis aid — not a guarantee of outcomes.
## 5. Run quick robustness checks
### Test timeframes and regime splits
Repeat the comparison over different regimes: recent 3‑month windows, 12‑month windows, and the specific event windows you tagged. Does the correlation hold only during clear risk‑on regimes? Does it weaken in risk‑off periods?
### Check alternative drivers
Always rule out proximate drivers: macro news (rates, CPI), on‑chain flows such as large transfers, or liquidity changes. Record these as competing tags in the same journal entry so they’re considered in the comparison.
## 6. Quantify and then qualify your conclusion
### From counts to narrative
After you’ve collected multiple tagged events and compared strategies, summarize your findings: frequency of co‑moves, the directionality observed, and any boundary conditions (for example, correlation strong only when equities are above a specific moving average). Use Strategy Comparison outputs and your journal notes to produce this narrative; label any numeric summaries as illustrative unless sourced.
### Be careful with phrasing
Use probabilistic language: the evidence may show that chip‑led rallies increase the probability of BTC upside in the short term, not that they guarantee it. Trade Strategy is a decision‑support tool for documenting and comparing these claims, not a source of guaranteed outcomes.
## Templates you can copy into Trade Strategy
- Strategy summary (one paragraph): "Hypothesis: Chip/tech equity rallies increase BTC upside probability via broad risk‑on flows. Entry signals: NVDA > X% or SOX outperformance > Y (illustrative). Timeframe: intraday to 7 days. Tags: Equities, ChipTrade, RiskOn."
- Journal entry template: "Date | Strategy | P&L | BTC move | Equity move | Candidate catalyst | Confidence | Tags | Notes"
- Comparison checklist: "Select same timeframe for all candidates → Filter journal by tag → Compare P&L distributions → Note boundary conditions → Update hypothesis."
## Roadmap note: planned AI decision‑support
Trade Strategy plans AI‑assisted BTC market analysis and probabilistic direction suggestions as part of the roadmap. These items are planned features and will be described as probabilistic decision support when released. The manual workflows above use released features today: Strategy Management, Historical Results Journal and Strategy Comparison.
## Conclusion
Attribution of cross‑asset moves requires discipline: a documented hypothesis, consistent journal entries with catalyst tags, and structured side‑by‑side comparisons. The Nvidia/chip trade example shows how a tech‑led risk‑on tailwind can coincide with BTC upside — but proving causation needs repeatable records, careful tagging and comparative analysis.
Use Strategy Management to capture assumptions, the Historical Results Journal to record event‑level outcomes, and Strategy Comparison to evaluate competing explanations. Build simple templates, run robustness checks, and treat numeric summaries as illustrative until validated.
Read the case study and try the workflow in your account: https://trade-strategy.com/blog
 2026-08-11
How to run an event-driven post‑mortem for your BTC strategy (step‑by‑step)
A step‑by‑step workflow for BTC event‑driven post‑mortems: record rules, log trades, compare pre/event/post windows using Trade Strategy to identify rule breakpoints and create testable updates.
 2026-08-11
How to Audit and Tag DeFi Strategies for Regulatory Exposure
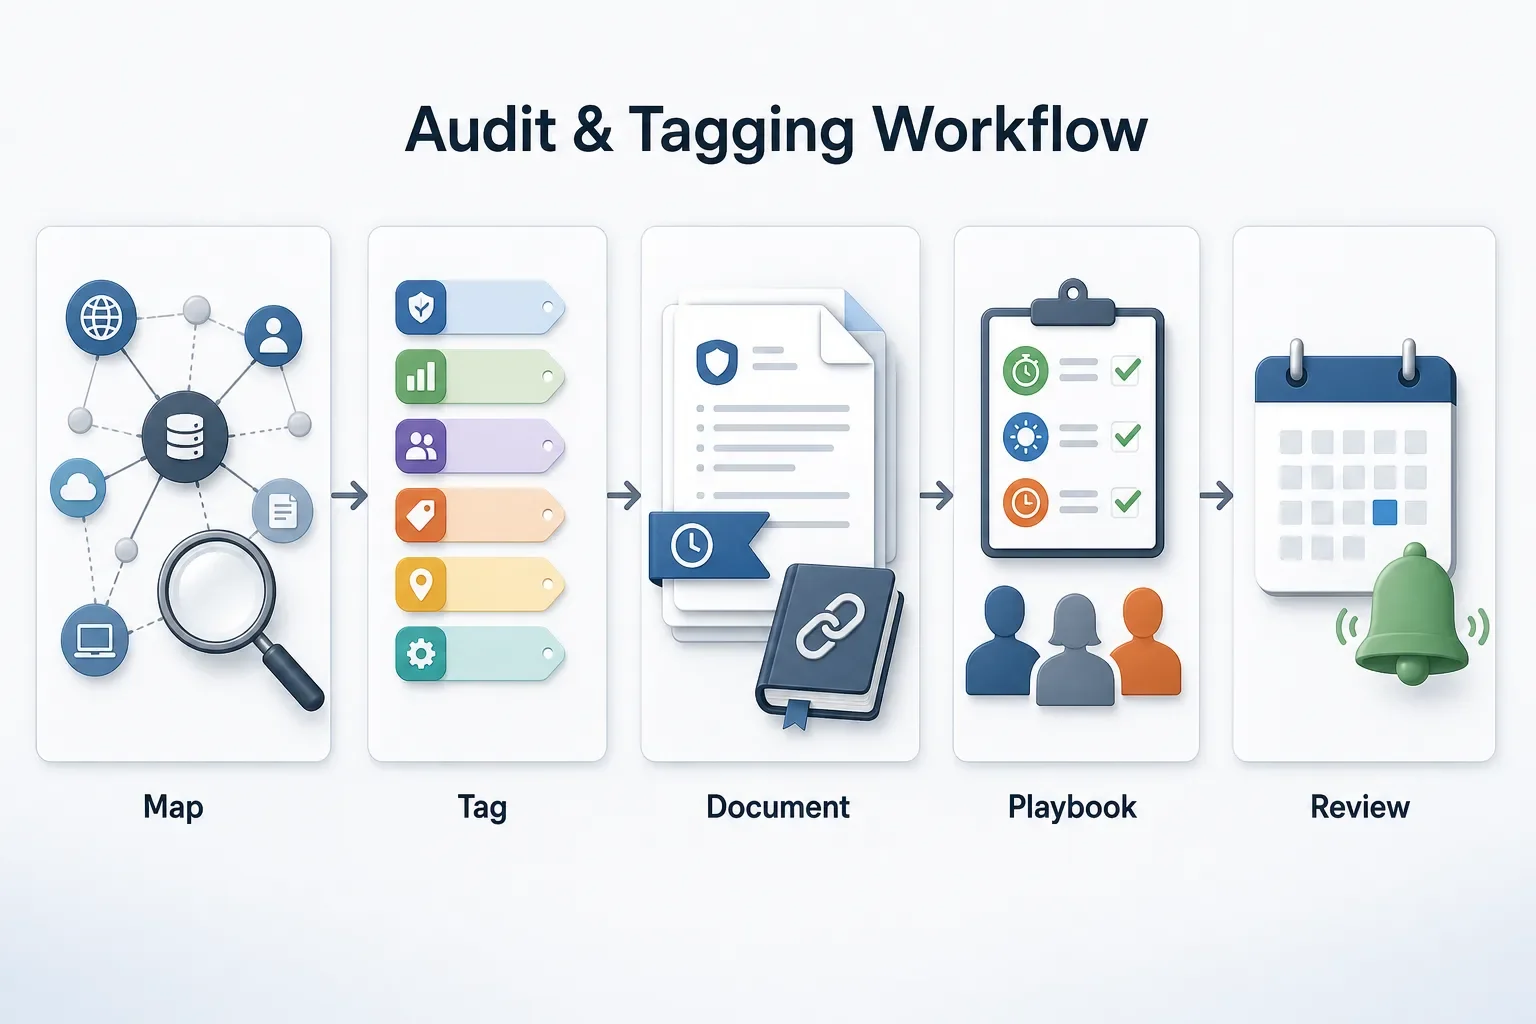
Practical, step‑by‑step workflow to map DeFi protocol touchpoints, tag regulatory exposure, preserve audit trails with documented rules and historical results, and prepare playbooks to respond quickly to enforcement events.
 2026-08-11
How to Adapt Your Strategies for a More Concentrated Altseason
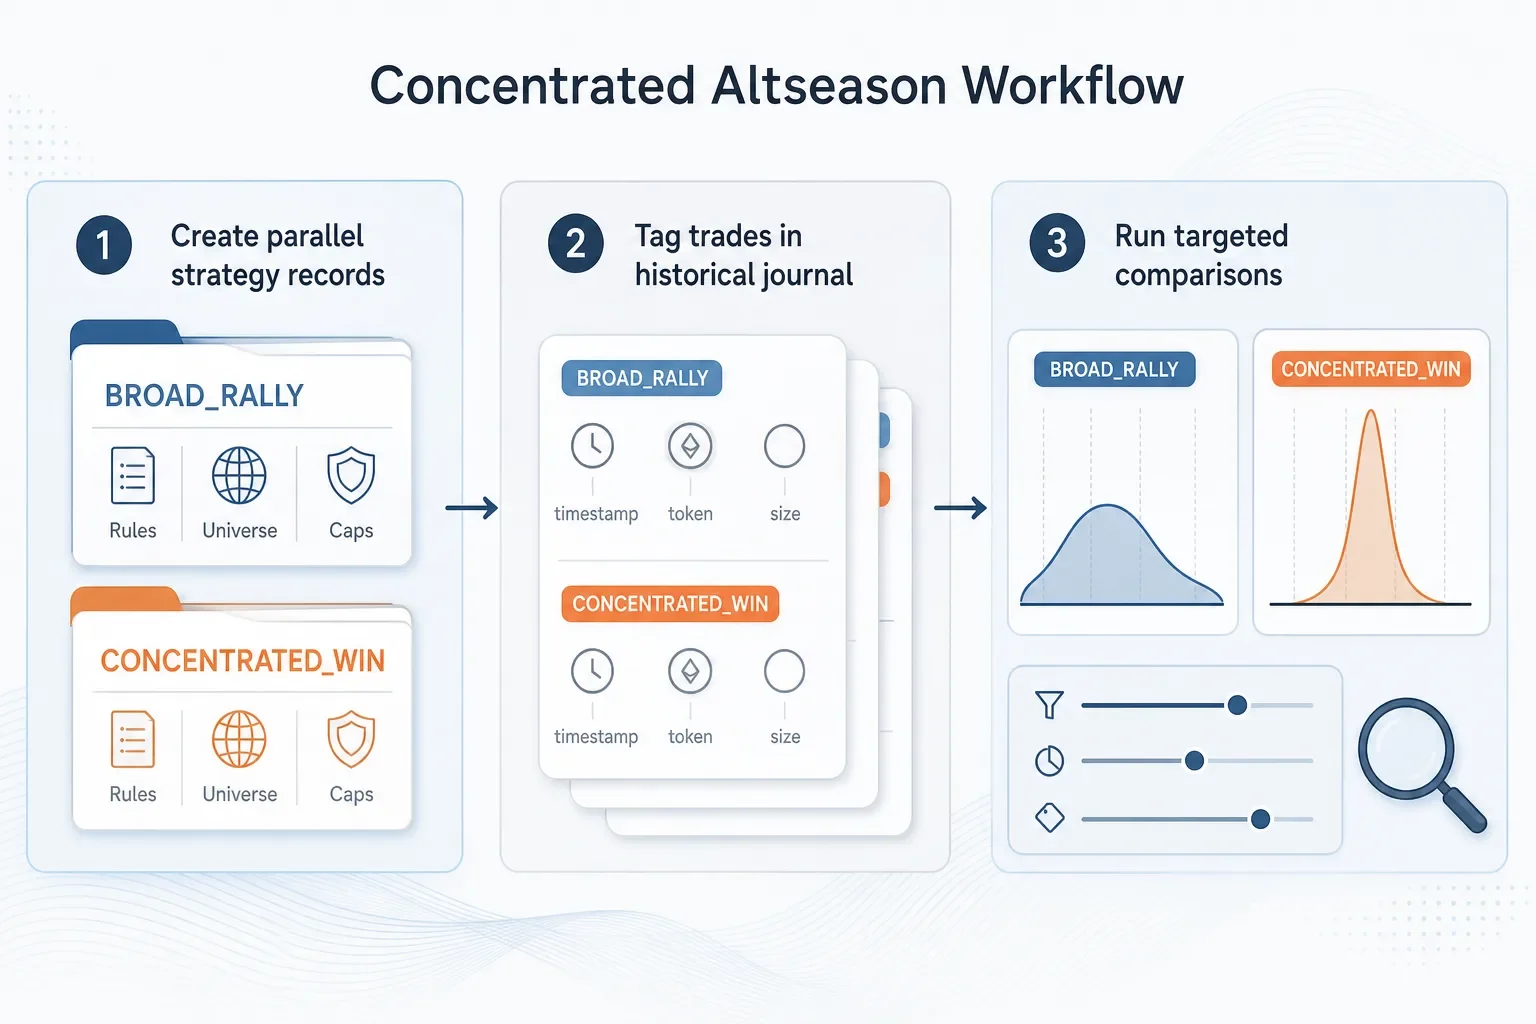
Step-by-step workflow to adapt trading strategies for a concentrated altseason: create regime-specific strategy records, tag outcomes in a historical journal, compare results across token subsets, and apply concentration-aware sizing and monitoring.