
How to backtest and validate BTC range-breakout strategies (step-by-step)
A step-by-step guide for active traders to backtest BTC range-breakout rules, measure false-breakout rates and record slippage. Includes sample parameter sets and a workflow using Trade Strategy to document and compare variants.

# How to backtest and validate BTC range-breakout strategies (step-by-step)
Bitcoin's recent $66.3K breakout attempt highlights a common trading problem: how to separate true breakouts from false moves — fast. Range breakouts work when price trends after the trigger, but fail when price snaps back into the range. This guide gives a practical, stepwise workflow you can use to backtest BTC range-breakout rules, measure false-breakout rates and record execution slippage. It also shows how to use Trade Strategy to document and compare variants so your decisions stay organized and repeatable.
## Overview: goals and key metrics
Before you run a single test, define what “validating a breakout” means for you. Typical validation goals and metrics:
- Signal definition: precise entry and confirmation rules (timeframe, breakout threshold, confirmation bars).
- False-breakout rate: share of breakouts failing to achieve a minimum follow-through target.
- Expectancy and drawdown: average outcome per trade and worst-case streaks.
- Execution slippage: difference between theoretical entry price and realistic fills.
- Robustness across regimes: performance across bull, bear and sideways periods.
Trade Strategy can help at several points in this workflow: create and store each strategy variant using Strategy Management, log historical results and notes in the Historical Results Journal, and compare variants using Strategy Comparison. These released features help you keep tests auditable and comparable across sample periods.
## Step 1 — Define clear, testable breakout rules
Write rules so a backtester (or your manual backtest) can apply them unambiguously.
Example rule elements for a BTC range-breakout:
- Range definition: high/low of the last 20 daily candles.
- Entry trigger: price closes above the 20-day high by at least X% or X ATR.
- Confirmation: close of the next 1–3 candles above the breakout level.
- Volume filter: current volume > 1.2× average volume over the lookback.
- Stop-loss: 1.5× ATR below entry or back inside the range.
- Profit target / exit: fixed multiple of ATR (e.g., 2× ATR), trailing stop, or time-based exit (e.g., 10 candles).
Create separate strategy records for each variant in Trade Strategy’s Strategy Management and note assumptions: timeframe, data source, slippage model, and sample period.
## Step 2 — Choose data and backtest controls
Good backtests control for biases and realistic fills.
Checklist for data and controls:
- Use the highest-resolution historical data your backtest requires (daily, hourly, or tick depending on entry rules).
- Align timezones and candle definitions (UTC vs exchange local time).
- Avoid lookahead bias: only use information available at the close of the candle that triggers the rule.
- Model transaction costs: exchange fees, spreads and a slippage estimate (see next step).
- Define in-sample and out-of-sample periods to test robustness.
If you run backtests in a separate engine or script, record the engine and parameters in the strategy record on Trade Strategy so your results remain auditable.
## Step 3 — Measure false-breakout rate and slippage
False-breakout rate (simple method):
1. For each breakout entry, check the next N candles (e.g., 5 daily candles).
2. Mark the breakout as “successful” if price reaches your follow-through target (e.g., 1× ATR or a fixed percent) before reversing back below the breakout level.
3. False-breakout rate = (number of failed breakouts) / (total breakouts).
Slippage measurement (practical approaches):
- Historical tick-level method: if tick or best-bid/ask data exists, simulate fills using the prevailing bid/ask to estimate realistic entry prices.
- Spread + execution tolerance: if you only have candle data, add a spread estimate and an execution tolerance (e.g., 0.05%–0.5% of price) to the theoretical entry and exit.
- Empirical recording: when trading live, record actual fills and compare them to theoretical prices to refine your slippage model.
Record slippage assumptions and measured values in the Historical Results Journal so you can track how slippage changes across market regimes.
## Step 4 — Run controlled experiments (parameter sweeps)
Test variations systematically:
- Lookback period (10 / 20 / 50 days)
- Confirmation bars (0 / 1 / 3 candles)
- Volume filter thresholds (1.0× / 1.2× / 1.5× average volume)
- Stop-loss and target multipliers (1× ATR stop / 2× ATR target, etc.)
Keep one variable changing at a time for interpretable results. For each run, export or record these fields: variant name, sample period, number of trades, win rate, average win/loss, max drawdown, false-breakout rate, average slippage, and notes about regime behavior.
Import or record those results in Trade Strategy’s Historical Results Journal and create one Strategy entry per variant. Use Strategy Comparison to view the differences side-by-side and surface tradeoffs — e.g., lower false-breakout rate vs. smaller average win.
## Practical example: three sample parameter sets for BTC range-breakouts
Below are three example rule-sets you can use as starting points. Treat these as parameter suggestions, not recommendations.
1) Conservative
- Range: 50-day high
- Entry: close > range high by 0.5% with 1 confirming daily close
- Volume: > 1.3× 50-day avg
- Stop: 1.5× ATR
- Exit: trailing stop 1× ATR
2) Balanced
- Range: 20-day high
- Entry: close > range high by 0.25% with no confirmation
- Volume: > 1.1× 20-day avg
- Stop: 1× ATR
- Exit: fixed 2× ATR profit target
3) Aggressive
- Range: 10-day high
- Entry: first close above range
- Volume: no filter
- Stop: 1× ATR
- Exit: time-based 10 candles or 3× ATR
Run these variants across the same sample periods, measure false-breakout rates and slippage, and log everything in Trade Strategy so you can compare outcomes and chosen tradeoffs.
## Step 5 — Validate across market regimes and refine
Breakouts behave differently in trending vs. choppy markets. Split your historical sample into regimes (e.g., bull run, correction, sideways) and measure the same metrics in each. A rule that performs well in trending markets but collapses in sideways conditions may need regime-aware filters or position sizing adjustments.
Record regime notes in each strategy’s documentation in Trade Strategy to keep the rationale for changes auditable.
## Practical journaling and comparison in Trade Strategy
- Use Strategy Management to store the precise rule text, assumptions and parameter sets for each variant.
- Log every backtest run and live trade outcome in the Historical Results Journal with fields for slippage and false-breakout flags.
- Use Strategy Comparison to quickly identify which parameter sets reduce false-breakout rates, or which require unacceptable slippage.
These released features let you build an evidence trail for decisions and re-run comparisons as market conditions change.
## Conclusion
Backtesting BTC range breakouts requires precise rule definition, realistic slippage modeling and a focus on false-breakout rates. Run controlled parameter sweeps, validate across regimes, and keep your results organized. Trade Strategy’s Strategy Management, Historical Results Journal and Strategy Comparison features help you document variants, record outcomes and compare metrics so you can make evidence-based decisions — without losing track of assumptions.
Download the backtest checklist and follow the walkthrough on our blog: https://trade-strategy.com/blog
Remember: past testing is decision support, not a guarantee of future outcomes. Use disciplined risk management and keep tests auditable.
 2026-08-11
How to run an event-driven post‑mortem for your BTC strategy (step‑by‑step)
A step‑by‑step workflow for BTC event‑driven post‑mortems: record rules, log trades, compare pre/event/post windows using Trade Strategy to identify rule breakpoints and create testable updates.
 2026-08-11
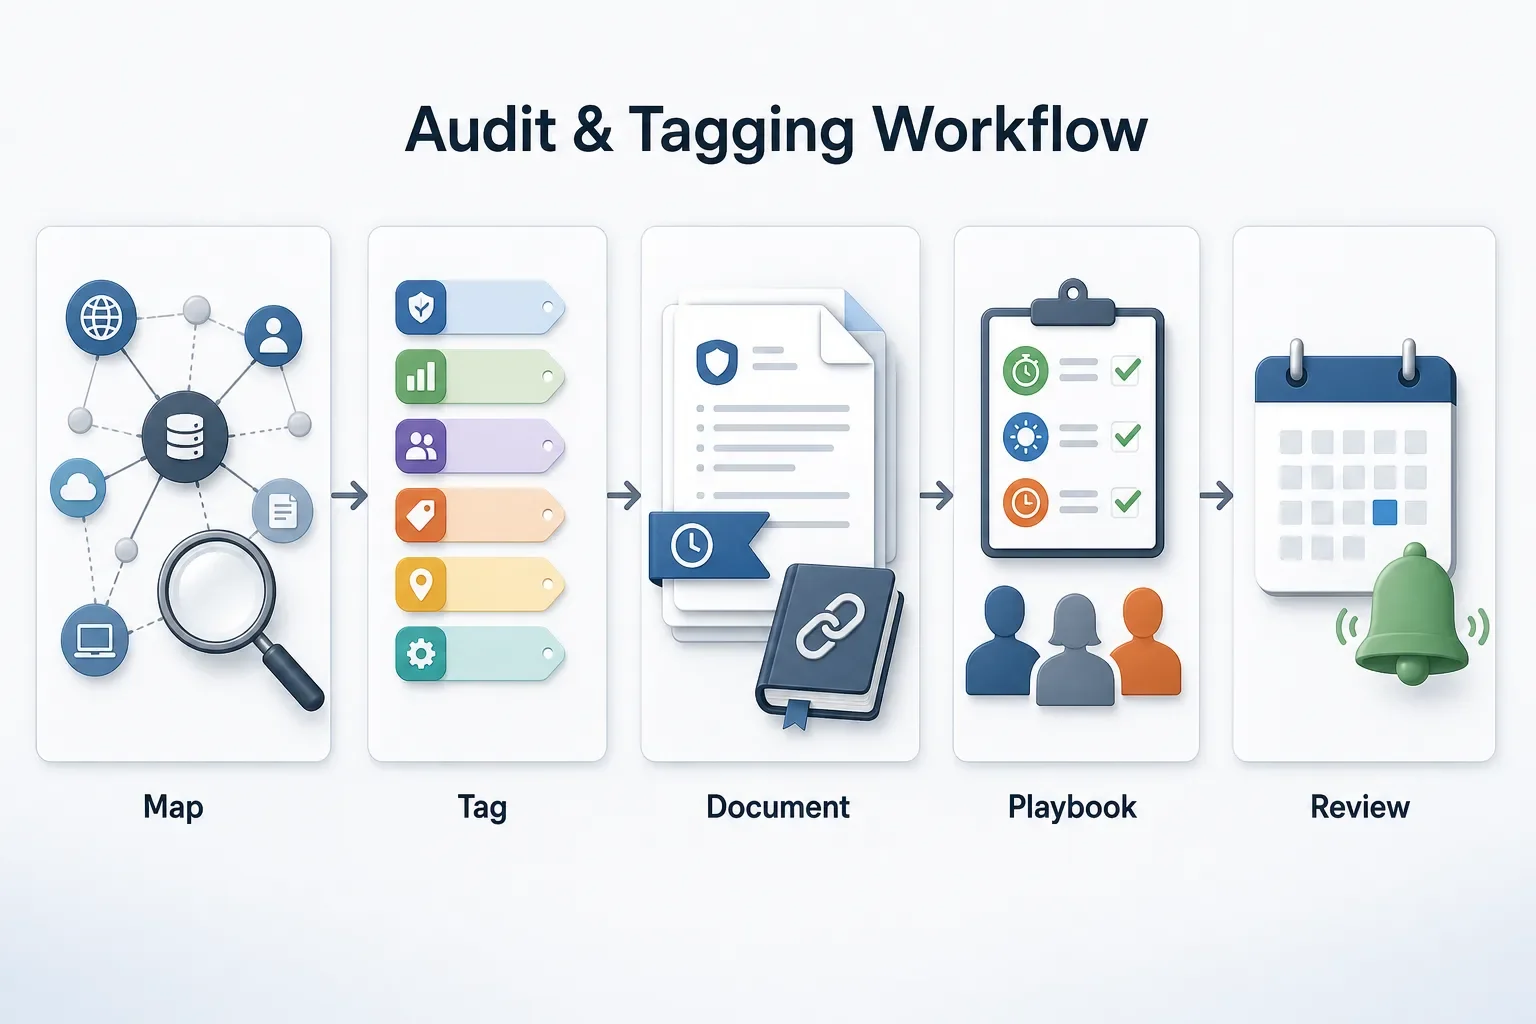
How to Audit and Tag DeFi Strategies for Regulatory Exposure
Practical, step‑by‑step workflow to map DeFi protocol touchpoints, tag regulatory exposure, preserve audit trails with documented rules and historical results, and prepare playbooks to respond quickly to enforcement events.
 2026-08-11
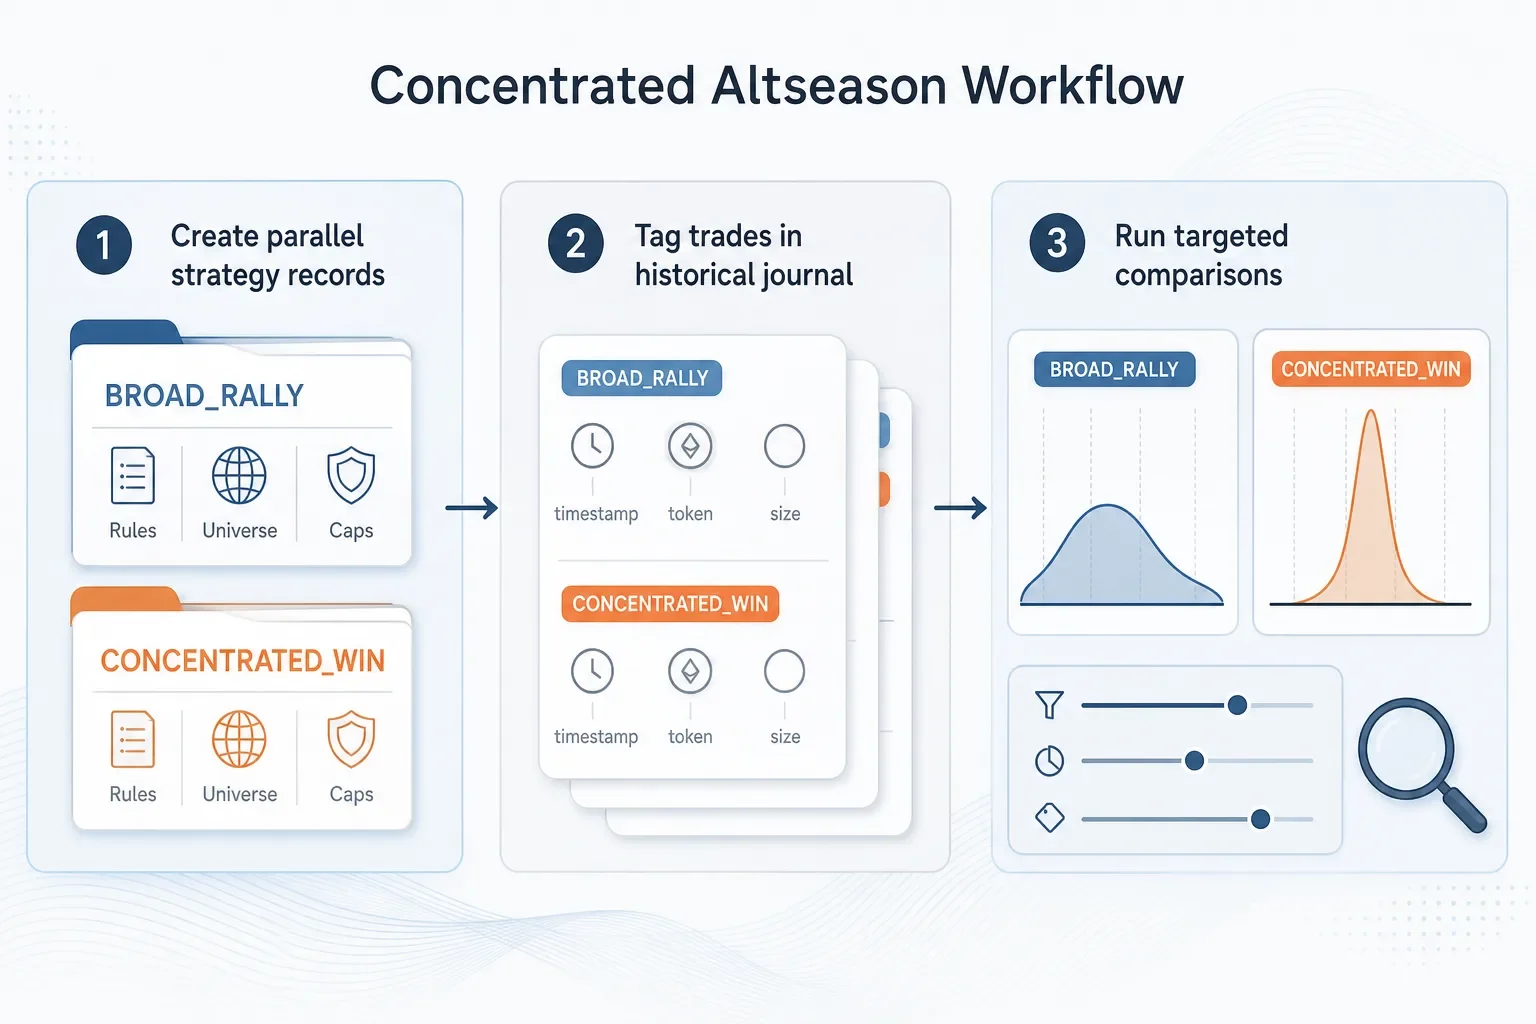
How to Adapt Your Strategies for a More Concentrated Altseason
Step-by-step workflow to adapt trading strategies for a concentrated altseason: create regime-specific strategy records, tag outcomes in a historical journal, compare results across token subsets, and apply concentration-aware sizing and monitoring.