
How to build and test an ETH/BTC bottom-finder: a practical, evidence-aware guide
A step-by-step guide to converting noisy ETH/BTC bottom signals into repeatable experiments: define rules, create a confirmation checklist, record trades and compare strategy variants using Trade Strategy for disciplined, probabilistic decision support.

# How to build and test an ETH/BTC bottom-finder: a practical, evidence-aware guide
Ambiguous on-chain signals are common around cross-asset inflection points. Instead of guessing, turn those noisy signals into repeatable experiments: define clear rules, require confirmations, record every outcome, and compare variants to learn what actually helps. This guide walks through a step-by-step workflow for designing, testing and documenting an ETH/BTC bottom strategy—and shows how to use Trade Strategy to organize strategies, record historical results and compare variants as part of a disciplined learning process.
## 1 — Start with a precise hypothesis
Vague idea: "ETH looks like it may be bottoming versus BTC."
Convert that into a testable hypothesis. Example template:
- Hypothesis: "If on-chain stress for ETH eases while ETH/BTC price forms a multi-day higher-low and short-term momentum turns neutral-to-bullish, then a long ETH/short BTC stance over the next 4–12 weeks has a higher-than-baseline probability of positive return versus holding BTC alone."
Why this matters: a clear hypothesis forces you to name the signals, timeframes, and expected outcome before you see results.
## 2 — Choose signals and data sources (on-chain + price)
Keep the signal set limited and measurable. Typical signal categories for ETH/BTC bottom detection:
- On-chain flow indicators (e.g., net exchange inflows/outflows for ETH vs BTC; large movement to or from custody addresses)
- Holder behavior (e.g., accumulation measures, long-term holder activity)
- Price structure (higher-lows on ETH/BTC, break of local resistance)
- Momentum/volatility filters (short-term RSI or volatility compression)
Practical rules:
- Use one primary on-chain indicator and one price confirmation to reduce false positives.
- Define exact time windows and numeric thresholds (e.g., 7-day net ETH exchange outflow > X, ETH/BTC 4H close above 20-period MA).
- Record the exact data source and timestamp for reproducibility.
## 3 — Build entry, exit and risk rules
Every experiment needs concrete rules. Keep them deterministic.
Example rule set (illustrative only):
- Entry: when (A) 7-day ETH net exchange flows are negative (net outflows) AND (B) ETH/BTC 1D forms a higher low vs prior 14 days AND (C) 4H RSI crosses above 45 — open a long ETH/short BTC position sized to risk 1% of capital.
- Stop: risk-based stop at a 4% adverse move from entry price on the pair basis; if ETH/BTC breaks below the prior multi-day low, close the position.
- Take-profit / time exit: scale half position at +8% and close remainder at +20% or after 12 weeks, whichever comes first.
Notes:
- Choose position sizing rules that you can follow consistently.
- Keep exit rules as crisp as entries—ambiguous exits create hindsight bias.
## 4 — Create a signal-confirmation checklist
A short checklist reduces cognitive error when signals arrive. Example checklist to require before taking action:
- [ ] Primary on-chain signal meets defined threshold and timestamp logged
- [ ] Price confirmation (higher-low or breakout) verified on chosen timeframe
- [ ] Volatility/momentum filter satisfied
- [ ] No overriding macro or liquidity event visible (hard stop if exchange halts are reported)
- [ ] Trade sizing and stop-loss calculated
Treat the checklist as part of the strategy definition so you can compare outcomes when you followed the checklist vs when you ignored it.
## 5 — Translate rules into a documented strategy in Trade Strategy
Why document: writing rules down reduces ambiguity and lets you later compare variants objectively.
How to use Trade Strategy (released features):
- Strategy management: create a new strategy and record the exact entry/exit/risk rules, data sources and assumptions.
- Historical results journal: after every trade, log the entry/exit, signals present at entry, position size, fees and a short rationale.
- Strategy comparison: save different rule sets as separate strategies or variants, then compare their recorded historical outcomes to see which filters or confirmations matter.
Keep notes about any discretionary deviation from rules so you can separate process errors from rule failure.
(Download the ETH/BTC strategy template to document and compare approaches on Trade Strategy: https://trade-strategy.com/blog)
## 6 — Run small live experiments and observe, don’t overfit
- Start with small exposure or paper trades. The goal is to collect evidence, not to prove correctness.
- Timebox experiments (for example, test each variant for 6–12 months or a minimum number of signal events).
- Record every outcome and tag it with the specific signals that fired. That makes it possible to later filter the journal and evaluate conditional performance.
Practical example of a journal entry format:
- Date: 2026-01-15
- Strategy variant: Onchain+PriceConfirm_v1
- Signals present: ETH 7d net outflow -X; ETH/BTC 1D higher-low
- Position: Long ETH/Short BTC, size 0.5% capital
- Entry price: X / Y
- Exit price: X / Y
- Result: +Z% on pair (note: record gross and net of fees)
- Notes: Checklist followed; macro: quiet
## 7 — Compare variants and ask the right questions
Use Trade Strategy's strategy comparison feature to group results by variant and ask:
- Which confirmation filters correspond to higher hit rates or better risk-adjusted outcomes?
- Do certain signals only work in specific regime conditions (low vol vs high vol)?
- How often do false positives occur, and what commonalities do those events share?
Focus on conditional insights (e.g., "when on-chain outflows occur plus momentum confirmation, outcomes look different than when only on-chain signals are present"). Avoid overclaiming—use probabilistic language: these comparisons suggest which filters are associated with different outcome distributions, not guarantees.
## 8 — Iterate and codify lessons
- If a filter consistently correlates with better outcomes, promote it to primary confirmation in your strategy.
- If a rule is rarely met or produces more false positives than expected, either tighten the threshold or retire it.
- Maintain a short lessons-learned section in each strategy record so future you understands why changes were made.
## Conclusion
Turning ambiguous ETH/BTC bottom signals into useful trading decisions requires disciplined hypothesis design, measurable rules, consistent record-keeping and comparative analysis. By treating each signal as an experiment and using tools to document strategies and historical results, you convert noise into structured learning. Trade Strategy supports this workflow by letting you create and document strategies, record historical results and compare strategy variants so you can see which filters matter in practice.
Next step: try the workflow. Download the ETH/BTC strategy template, create a strategy in Trade Strategy, run a small live or paper experiment and log each outcome. Over time you’ll build evidence to make probabilistic, repeatable decisions rather than one-off calls.
 2026-08-11
How to run an event-driven post‑mortem for your BTC strategy (step‑by‑step)
A step‑by‑step workflow for BTC event‑driven post‑mortems: record rules, log trades, compare pre/event/post windows using Trade Strategy to identify rule breakpoints and create testable updates.
 2026-08-11
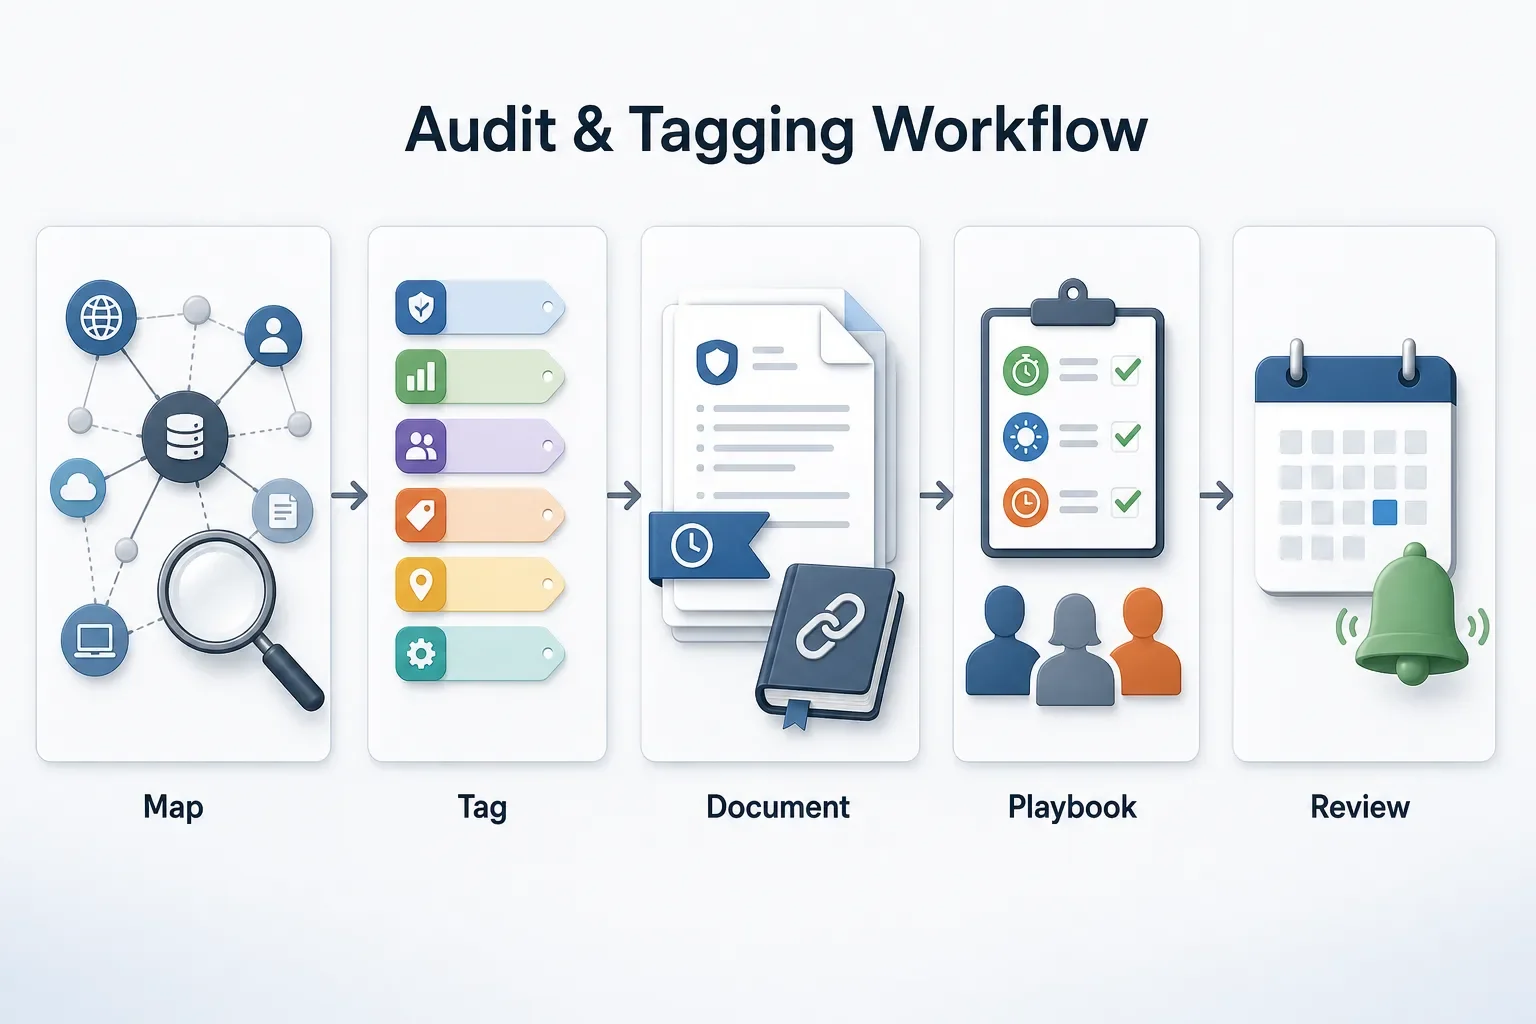
How to Audit and Tag DeFi Strategies for Regulatory Exposure
Practical, step‑by‑step workflow to map DeFi protocol touchpoints, tag regulatory exposure, preserve audit trails with documented rules and historical results, and prepare playbooks to respond quickly to enforcement events.
 2026-08-11
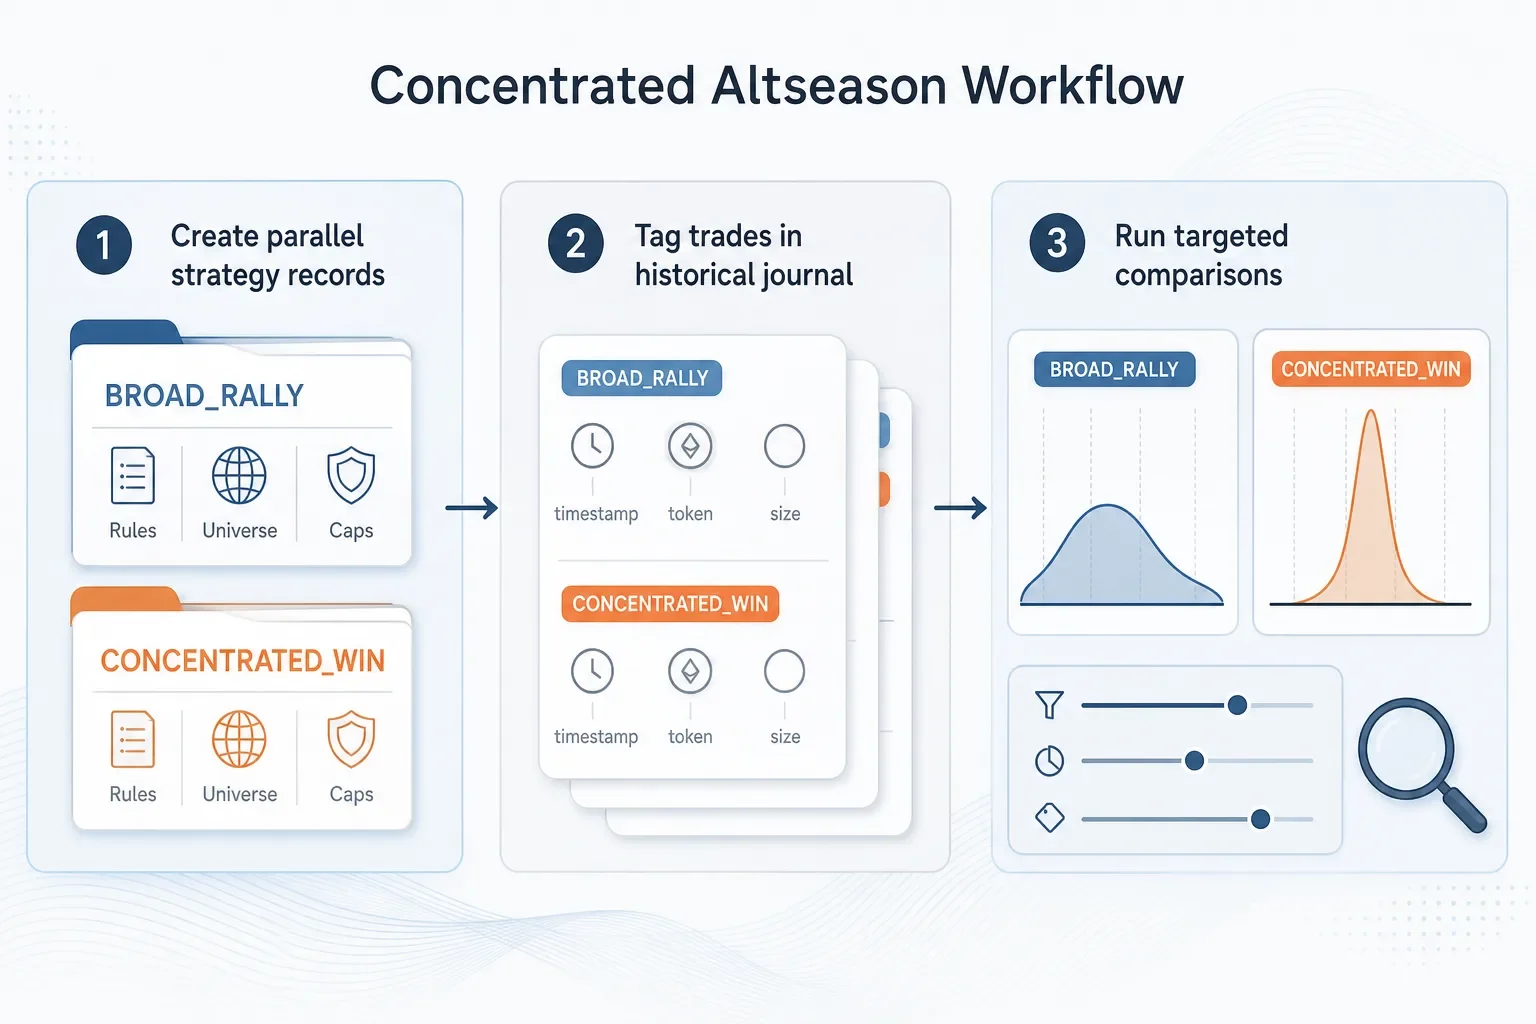
How to Adapt Your Strategies for a More Concentrated Altseason
Step-by-step workflow to adapt trading strategies for a concentrated altseason: create regime-specific strategy records, tag outcomes in a historical journal, compare results across token subsets, and apply concentration-aware sizing and monitoring.