
What the Hyperliquid SK Hynix Flash Crash Teaches Derivatives Traders
A single exchange microstructure failure can turn a well‑designed strategy into a surprising loss. Learn probable causes of the Hyperliquid SK Hynix flash crash, immediate risk steps, and how to document the event for better resilience.
# What the Hyperliquid SK Hynix Flash Crash Teaches Derivatives Traders
A single exchange microstructure failure can turn a well‑designed strategy into a surprising loss. The recent flash crash that pushed SK Hynix perpetuals to roughly $900 on one venue is a reminder: venue‑specific tail risk lives in liquidity, price feeds and matching‑engine behavior. This post‑mortem explains probable causes, immediate risk‑mitigation steps, and a practical how‑to for documenting the event so your desk learns from it.
## What probably happened: three microstructure failure modes
1. Liquidity evaporation
- Perpetual markets can look deep in normal conditions but dry up when an orderbook freezes or major participants pull quotes. A thin orderbook amplifies market orders and liquidations into outsized price moves.
2. Broken price feeds or oracles
- If an exchange consumes a bad price feed or an on‑chain oracle lags or misreports, the exchange's internal mark price or funding reference can diverge dramatically from the market. That divergence can trigger liquidations or improper margin calculations.
3. Matching‑engine anomalies
- Matching engines are complex software. Edge cases (re‑entrancy, timestamp misordering, bad rounding logic) can produce anomalous fills, partial match mismatches or execution at stale prices.
The Hyperliquid incident likely involved one or more of the above, producing rapid price movement, unexpected fills and cascaded liquidations on that venue. Importantly, the event was venue‑specific — other venues did not necessarily move in the same way at the same time.
## Immediate trader actions during an exchange flash crash
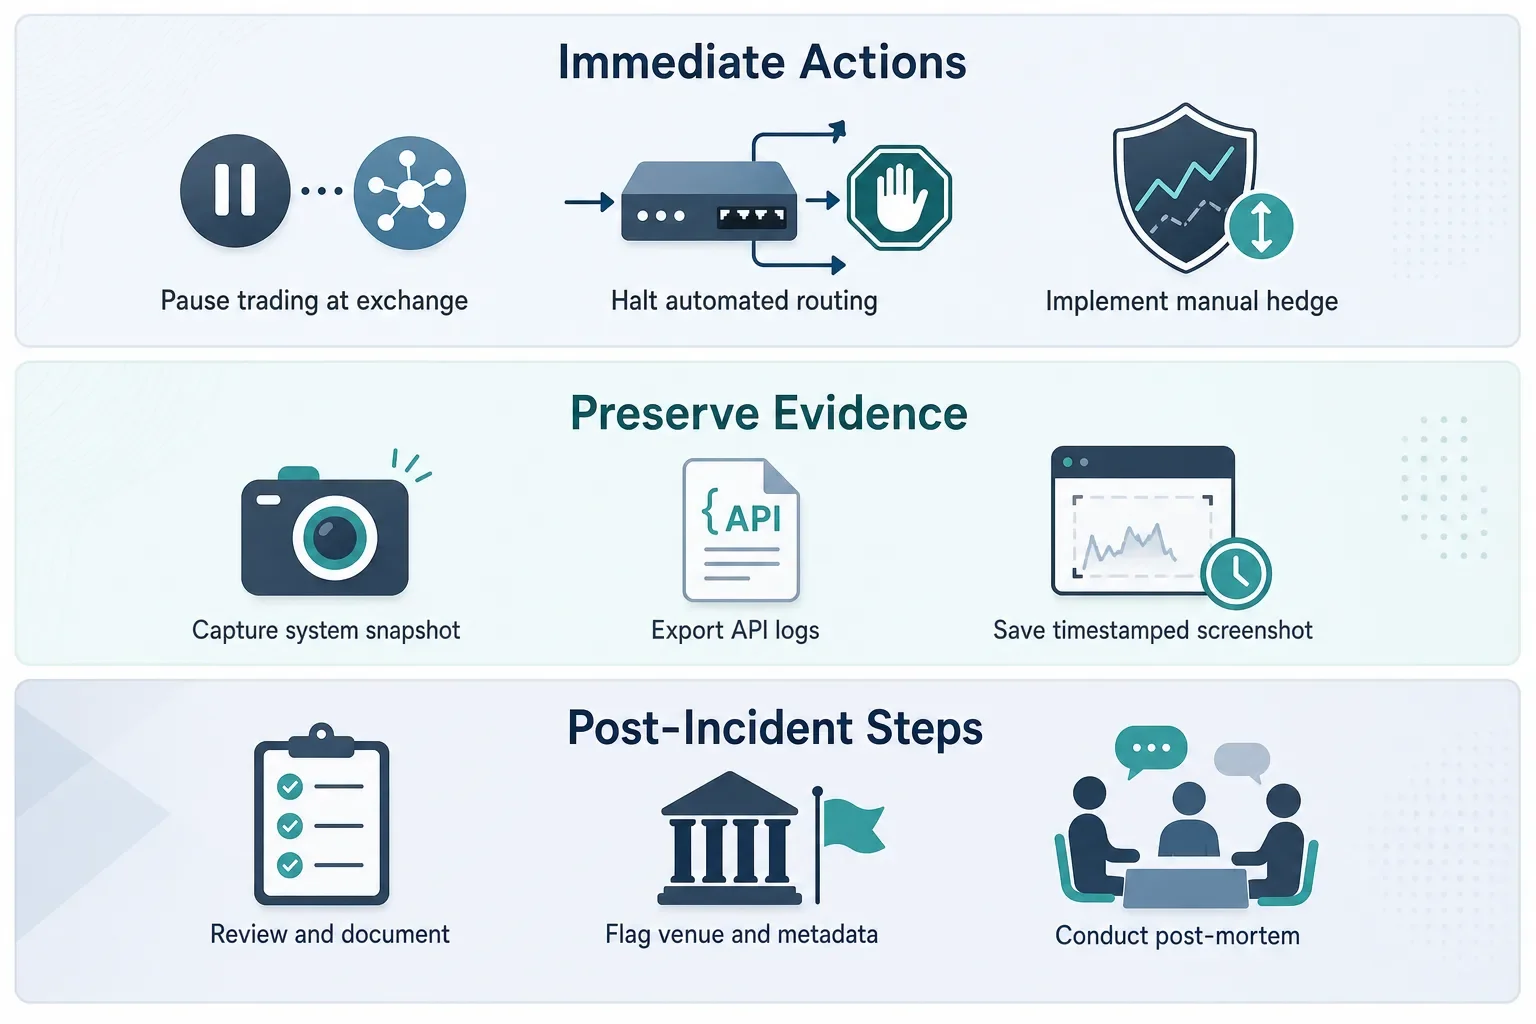
- Pause automated order routing to the affected venue. If your system can isolate a venue, stop new orders and hedges there.
- Avoid blanket reductions without context. Large, indiscriminate cancellations can lock in realized losses if fills and prices are already anomalous.
- Preserve evidence. Capture order books, trade tapes, API logs, and screenshots with timestamps. These are critical for post‑mortem reconciliation and exchange disputes.
- Check margin and liquidation states manually. If possible, manually hedge exposures on other venues rather than executing at the failing venue.
- Announce the incident internally. A short internal bulletin (time, instrument, venue, observed symptoms) ensures teams act consistently.
## A practical how‑to: document the event so you can learn from it
Good record keeping turns a painful trade into usable learning. Treat the flash crash as an incident to be added to your strategy records and post‑trade journal.
### 1) Strategy management: record exchange rules and assumptions
- Add or update the strategy metadata to capture venue assumptions. Example fields to include:
- Venue name and identifier
- Instrument tick and contract specifications
- Funding calculation method and cadence
- Expected minimum displayed depth at X% of mid
- Known feed sources and oracles
Example entry (short):
- Strategy: Mean‑reversion SKHIX Futures
- Venue: VenueX
- Assumptions: funding aligned to VenueX index; min 5 BTC displayed depth at 0.5% from mid
Capturing these items makes it easier to spot where assumptions failed.
### 2) Historical results journal: log anomalous fills and slippage
Record each anomalous execution as a dedicated event in your results journal rather than burying it inside aggregated PnL. Useful fields:
- Timestamp (ISO)
- Instrument and venue
- Order type, size, intended price
- Executed price and executed size
- Best bid/ask at time of order (or nearby snapshot)
- Calculated slippage (executed vs intended)
- Margin/realized PnL impact
- Attachments: raw API logs, screenshots, exchange acknowledge IDs
- Narrative: what you observed and initial hypotheses
Example journal note:
- 2026-07-28T14:03:12Z | SKHIX-PERP | VenueX | Market sell 50 contracts | Executed @ $900 | Expected mid $3,200 | Slippage 72% | Notes: matching‑engine returned partial fills with negative prices; exchange support ticket #12345
Keeping these entries searchable and linked to the strategy helps quantify how outliers affect long‑term performance.
### 3) Strategy comparison: quantify resilience across venues
After logging events, compare strategies or the same strategy across venues. Key comparisons:
- Realized slippage distribution by venue
- Frequency of non‑standard fills (percentage of trades with slippage > X%)
- Worst single‑trade drawdown by venue
A simple example analysis: compute median and 95th percentile slippage for VenueA vs VenueB for the last 12 months. If one venue shows a heavier tail, consider tighter venue‑level controls or exclusions.
## Operational checklist to add after the incident
- Add venue‑specific checks to pre‑trade workflows (feed health, recent volatility, orderbook depth).
- Build or update a simple incident checklist: pause new orders, preserve logs, notify ops, open exchange support ticket.
- Flag the affected venue in your strategy metadata and mark strategies that traded there for review.
- Schedule a post‑mortem: include quant, execution, risk, and ops. Review journal entries and decide whether to change assumptions.
## Conclusion
Exchange flash crashes expose the difference between a statistically good strategy and an operationally robust one. The lesson is not that flash crashes are predictable — they are not — but that disciplined documentation, fast incident playbooks and cross‑venue comparisons turn surprise losses into actionable improvements. Record the facts, quantify the impact, and update your assumptions so the next iteration of the strategy reflects what actually happened.
If you use a platform to centralize strategy metadata and historical results, add a template for anomalous fills and a venue‑resilience review to your regular cadence. For more on documenting and comparing strategies, see the Trade Strategy blog: https://trade-strategy.com/blog
---
If you want to standardize incident journals and venue comparisons for your desk, consider centralizing those records with Trade Strategy — learn more at https://trade-strategy.com
 2026-08-11
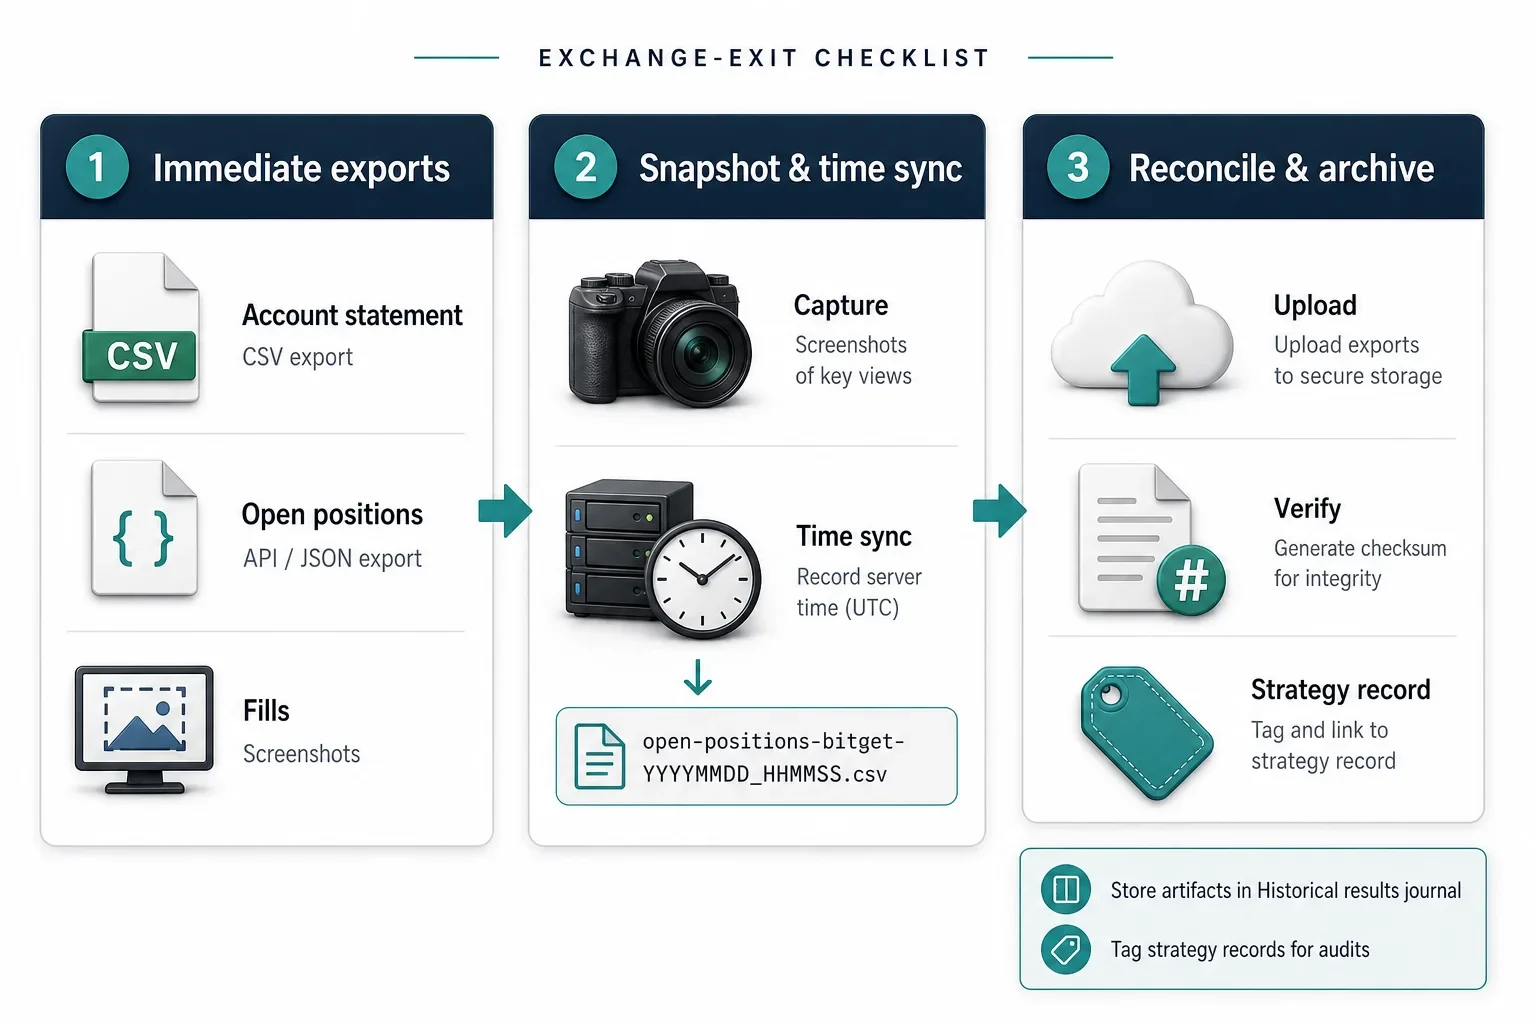
Exchange-exit checklist: export, snapshot and reconcile for Bitget's Japan exit
A practical, step-by-step checklist to export trade history, snapshot open positions and reconcile balances after Bitget's Japan exit — plus how to store verifiable evidence in Trade Strategy's strategy records and Historical results journal.
 2026-08-01
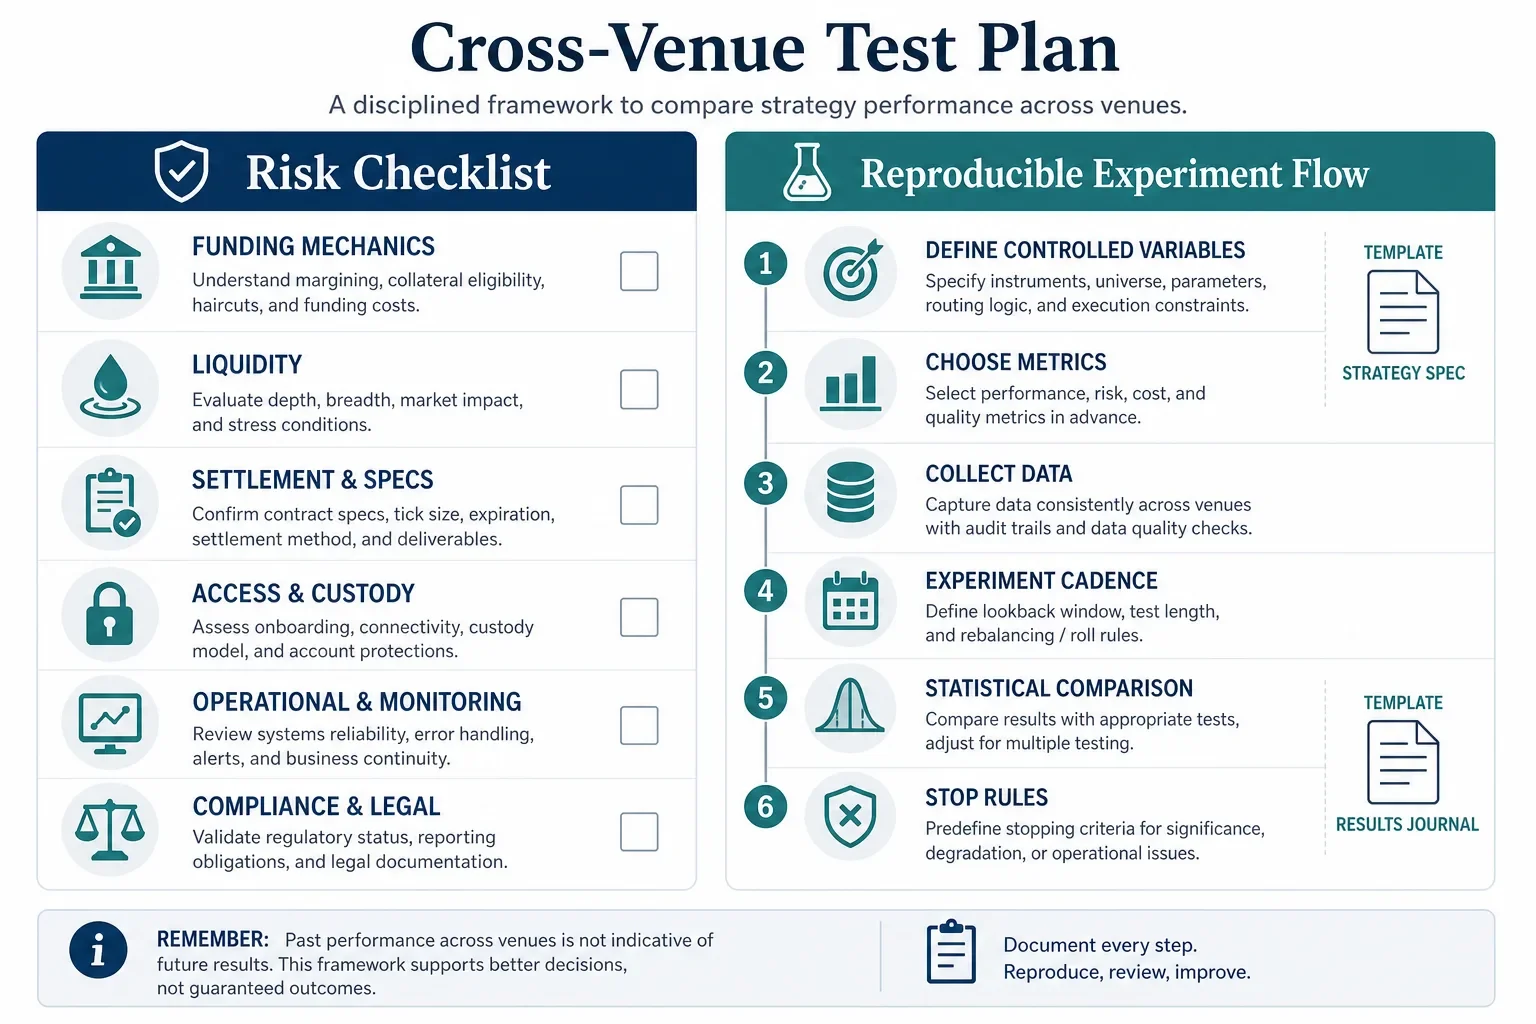
What the CME–CFTC Fight Means for Your Perpetual‑Futures Strategies — A Trader’s Checklist & Test Plan
A practical checklist and reproducible test plan to audit and re‑test perpetual‑futures strategies across CME‑style and onchain venues. Includes templates and hypothetical case studies to help teams quantify venue‑driven risks.
 2026-07-30
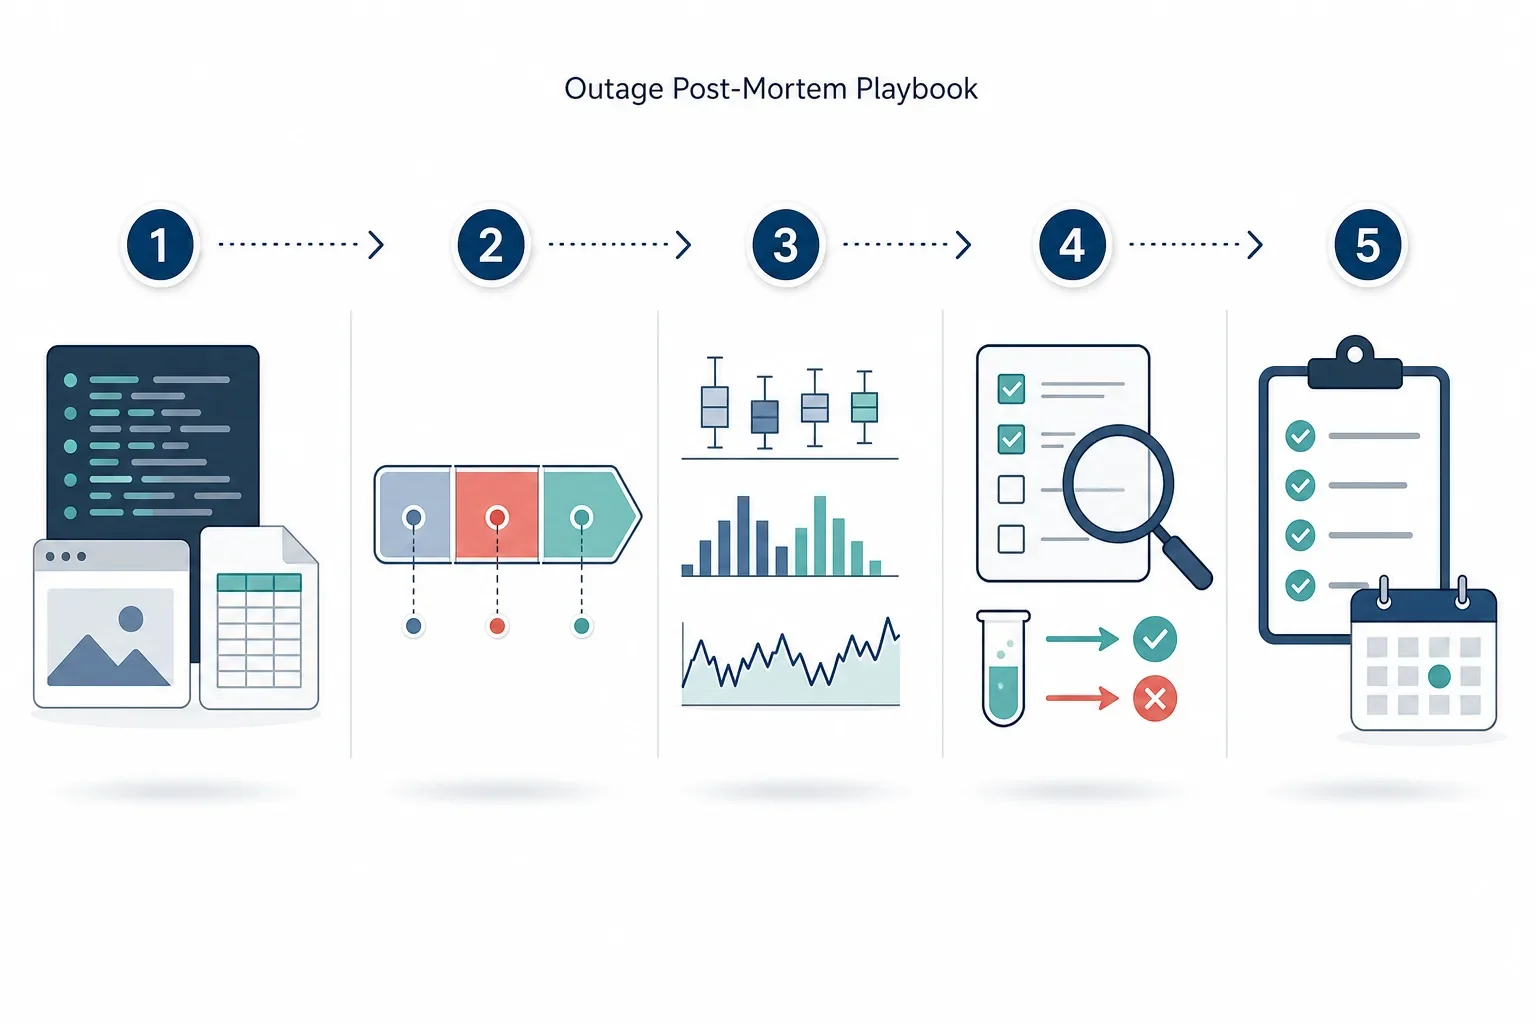
How to run a trading-strategy post‑mortem after an exchange outage
Step‑by‑step post‑mortem guide for derivatives traders: collect execution artifacts, build a timeline, compute normalized slippage and fill metrics, and translate findings into process changes with a ready‑to‑use template.