
How Institutional Execution Tools Are Changing Prediction‑Market Trading — A Playbook for Quants
Talos’ institutional execution for Kalshi reduces friction for systematic prediction‑market strategies—but quants must add connectivity, execution simulation and monitoring. This playbook outlines practical steps and shows how Trade Strategy can document experiments today.

# How Institutional Execution Tools Are Changing Prediction‑Market Trading — A Playbook for Quants
Talos bringing institutional‑grade execution to Kalshi reduces a major barrier for systematic use of prediction markets. For quant teams and prop desks, this change is both an opportunity and a technical challenge: better order routing, execution types and risk controls enable repeatable strategies, but they also require new connectors, execution modeling and monitoring frameworks.
This article explains what changed, outlines a practical playbook for adoption, and shows how Trade Strategy’s released features can be used today to document experiments and compare strategy variants while teams plan execution integrations.
## Why institutional execution matters for prediction markets
Prediction markets historically lacked the plumbing familiar to institutional traders: programmatic connectivity, advanced order types, routing logic and broker‑level risk controls. Those gaps meant higher friction for systematic strategies because:
- Order fills were unpredictable and often manual.
- Slippage could be large for size or during volatile moves.
- Risk controls (pre‑trade limits, reject rules) were not consistently available.
With institutional execution providers integrating with prediction exchanges, quant teams can treat these markets more like any other tradable venue: execution becomes a component to model and test rather than an unsolved operational problem.
## The impact on quant workflows
Three areas in your strategy lifecycle change materially:
1. Connectivity and data ingestion — need for reliable market and execution feeds.
2. Execution modeling and simulation — incorporate order types, routing and slippage.
3. Monitoring and post‑trade analysis — measure realized fills vs. expectations and iterate.
Below is a hands‑on playbook that walks through each area.
## Playbook: From connectivity to production readiness
### 1) Define scope and integration points
Tasks:
- Inventory strategy touchpoints: market data, order placement, cancels, fills, and risk messages.
- Decide on phased integration: start with read‑only market data and simulated orders, then add routing/execution once stable.
Practical note: use a reproducible experiment plan to capture assumptions about latency, fill models and order types before you build a connector.
### 2) Build or plan a connector (market + execution data)
Requirements:
- Market feed: best bid/ask, timestamped trades, volume buckets, order book depth if available.
- Execution feed: ack/cancel/fill messages, reason codes, and per‑order metadata (venue, child orders, algo id).
Start with a lightweight adapter that writes raw events to a normalized store. This lets you run simulations and replay tests without re‑hitting the live API.
### 3) Execution simulation and slippage modeling
Why it matters: institutional order types and routing reduce uncertainty but do not eliminate slippage. Modelling realistic fills is essential for valid backtests.
Suggested approach:
- Microstructure model: base slippage on available depth and order size. Example functional form:
slippage(size) = k * (size / depth_at_price_level)^alpha
where k and alpha are calibration parameters derived from filling small sample orders.
- Include time‑to‑fill and partial fills. Model IOC/PO/limit behaviors differently: IOC may fail entirely at worse prices; limit orders may sit and fill over time.
- Model routing and child orders: if your routing logic slices into N child orders, simulate the execution schedule and market impact per child slice.
Calibration: run controlled paper trades (or small live fills) to calibrate k and alpha. Track realized slippage across different hours and event conditions.
### 4) Risk controls and pre‑trade checks
Institutional execution exposes pre‑trade reject messages (size limits, margin checks). Encode pre‑trade checks in your execution simulator so the backtest reflects real acceptance rates.
Checklist items:
- Pre‑trade credit/limit lookup
- Reject handling logic (e.g., reduce size, fallback venue)
- Timeouts and reprice policies
### 5) Monitoring and post‑trade analysis
Track these metrics continuously:
- Fill rate and partial fill frequency
- Realized vs. expected slippage
- Time to first fill and time to completion
- Cancel rate and reject reasons
- Per‑strategy P&L attribution (execution cost vs. strategy edge)
Visualize trends and anomalies by strategy, time of day, and market condition.
## Practical example: a simple prediction‑market mean‑reversion test
Scenario: your strategy bets that a short, mean‑reversion move will occur after a rapid price swing in a Kalshi contract.
Steps:
1. Simulate signal generation with historical market snapshots.
2. Use a slippage model that assumes IOC for immediate exposure and a limit fallback if IOC fails.
3. Simulate routing that slices orders across short time windows to reduce footprint.
4. Capture expected vs. realized P&L per trade and aggregate by sample period.
This exercise surfaces whether your edge survives realistic fills and where the execution costs are concentrated.
## How to use Trade Strategy while you build execution integrations
While engineering teams build connectors and calibrate execution models, Trade Strategy’s released features can be used today to formalize and accelerate adoption:
- Strategy management: create and document prediction‑market strategies, record rules and assumptions about fills and routing, and version your hypotheses.
- Historical results journal: record simulated and controlled live fills, link them to the strategy version and capture contextual notes (market conditions, API version, routing rules).
- Strategy comparison: compare variants side‑by‑side (different slippage models, order types, routing logic) using saved assumptions and recorded historical results to see where the edge is most robust.
Using these capabilities makes it easier to hand off a reproducible experiment to execution engineers or to present a readiness case to trading ops.
## Operational recommendations for quant teams
- Start small: validate connectivity and slippage models with a limited set of contracts and low notional fills.
- Instrument everything: store raw events to replay fills for debugging and calibration.
- Maintain an experiment log: every change to routing, model parameters or pre‑trade checks should be recorded and tied to test results.
- Iterate on monitoring thresholds: set alerts for widening slippage or rising reject rates rather than fixed P&L triggers.
## Conclusion
Institutional execution tools lower a major barrier to systematic participation in prediction markets, but they don’t remove the need for careful engineering. For quants, the work shifts upstream: build reliable connectors, model fills and routing precisely, and institutionalize monitoring.
Trade Strategy’s released features—strategy management, historical results journal and strategy comparison—provide practical ways to document experiments, capture assumptions and compare results while teams plan and build execution integrations.
Read the full playbook and download a readiness checklist on our blog: https://trade-strategy.com/blog
 2026-08-11
How to Treat Bitcoin ETF Inflows as a Testable Trading Signal (with a Trade Strategy template)
Turn Bitcoin ETF inflows into a repeatable experiment: source flows, design falsifiable hypotheses, backtest with realistic costs, and use Trade Strategy to document and compare results. Includes a downloadable experiment template.
 2026-08-11
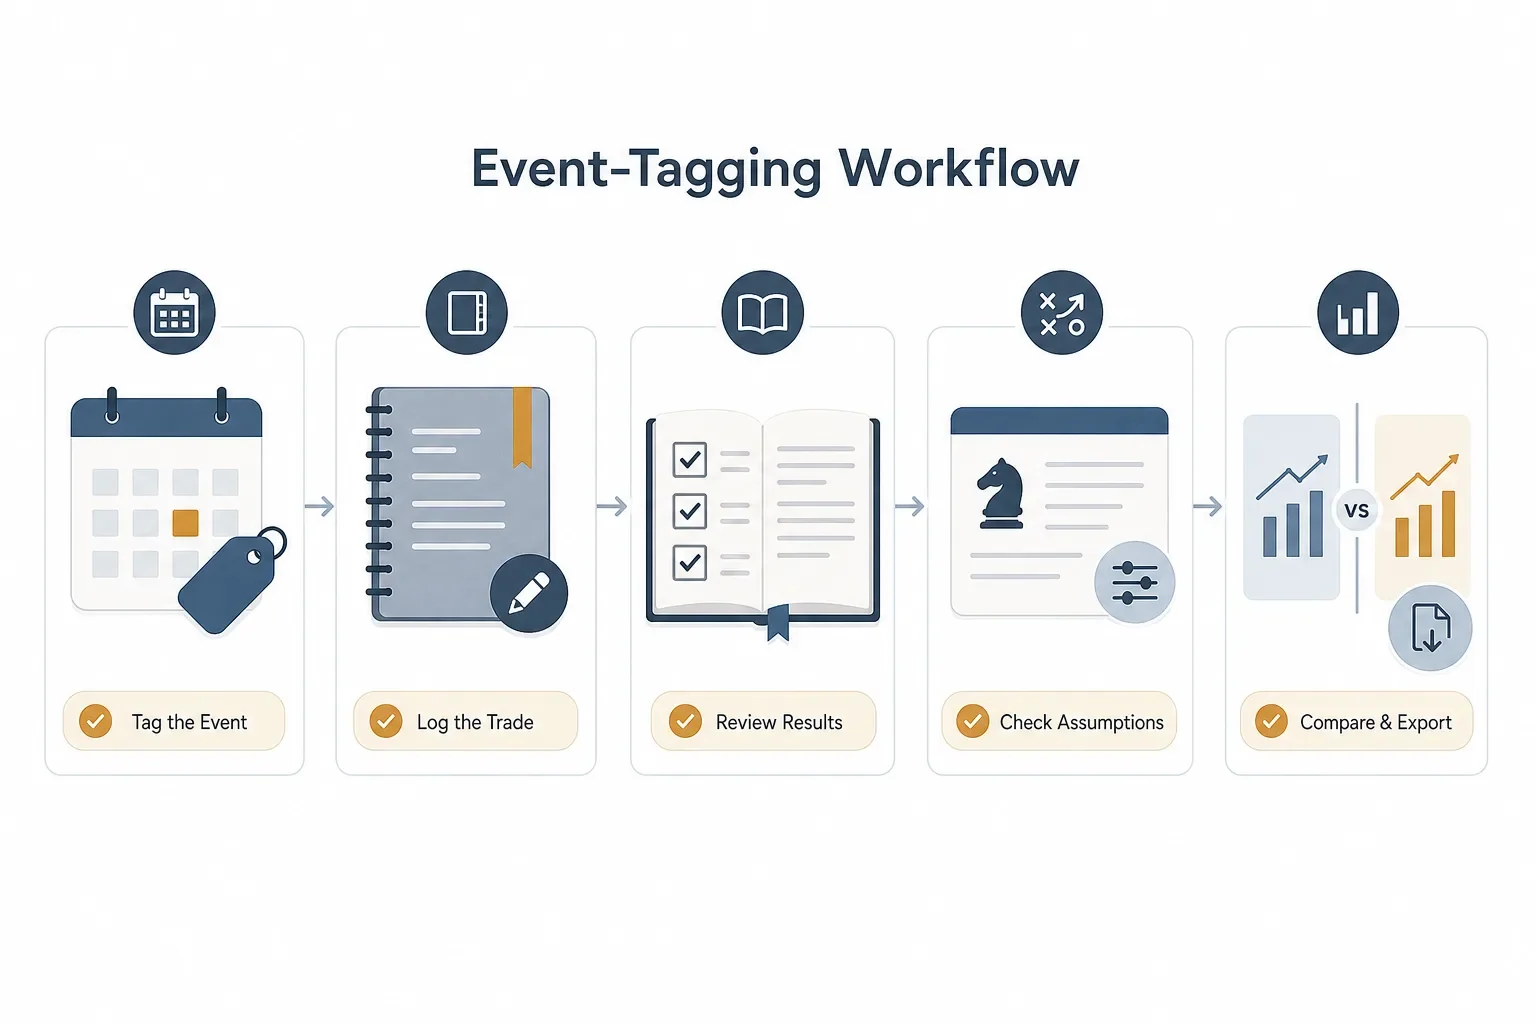
How to Audit Your Crypto Strategies After Earnings-Driven Volatility: A Step-by-Step Event-Tagging Workflow
A practical, step-by-step workflow to tag trades around earnings-driven crypto volatility, record outcomes in a Historical results journal, and use Strategy management and Strategy comparison to spot resilient rules.
 2026-08-11
When AI Flows Cool and Crypto Breaks Out: A Practical Playbook for Regime-Shift Trading
A practical playbook for detecting and responding to regime shifts when AI-driven flows cool and crypto potentially breaks out. Steps to detect, tag, re-test and compare strategies using Trade Strategy's released features.