
How to Turn BTC ETF Inflows and ETH Outflows into Testable Trade Hypotheses
A step-by-step guide for turning BTC ETF inflow and ETH outflow headlines into measurable trade hypotheses, with a practical template and checklist to log, test and iterate.
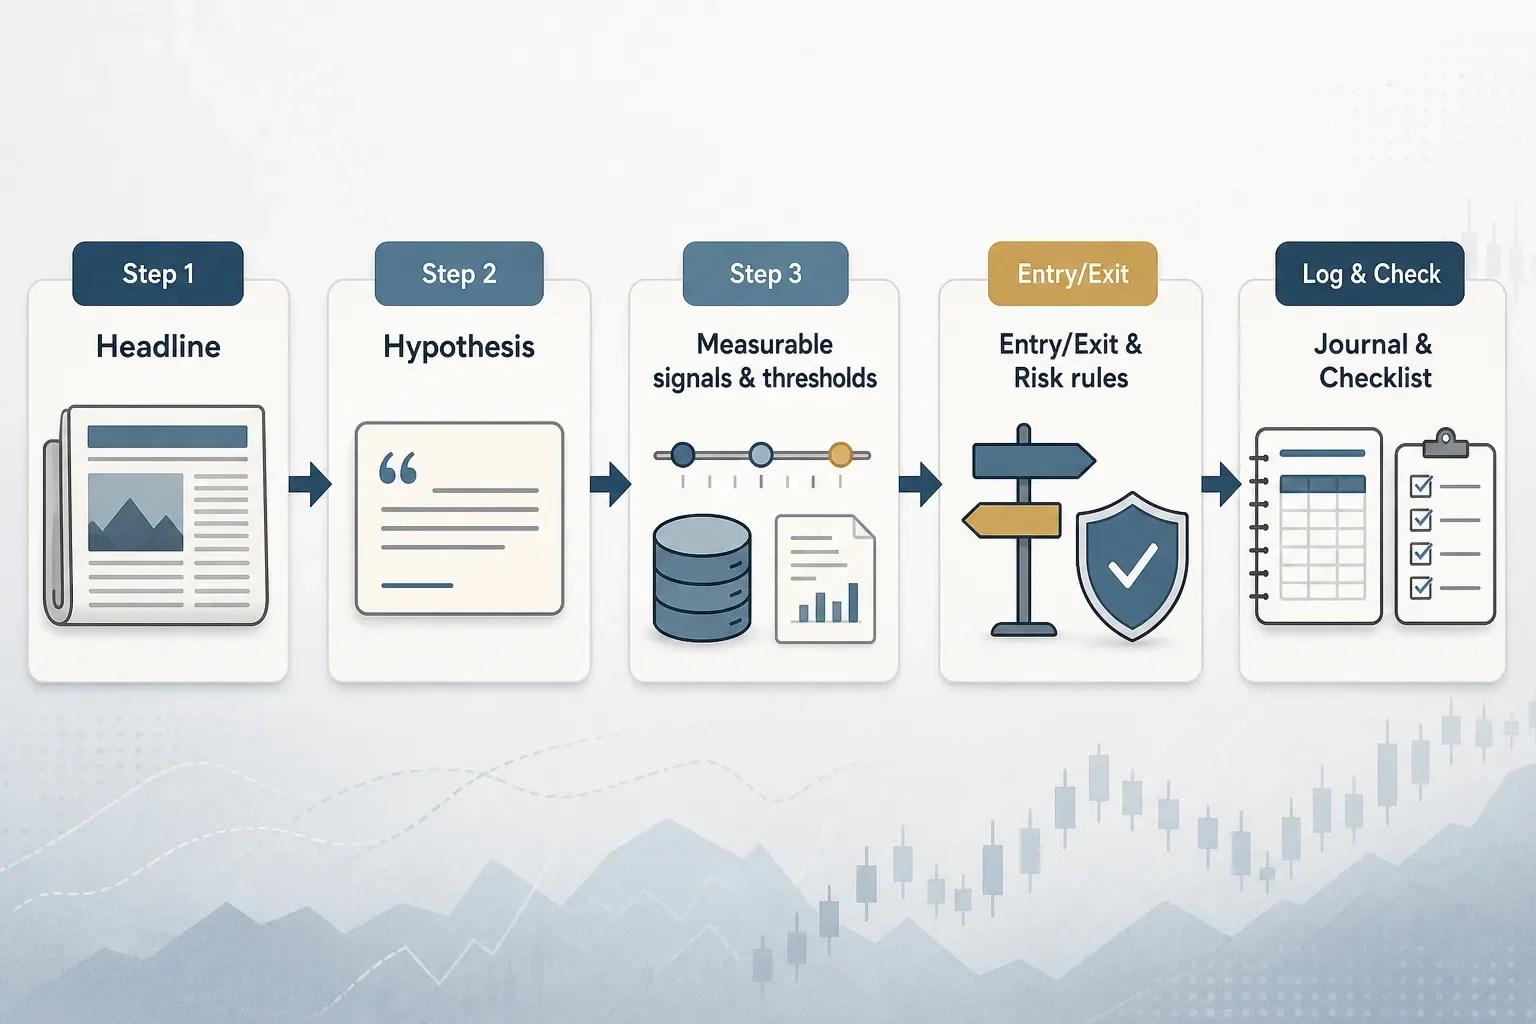
# How to Turn BTC ETF Inflows and ETH Outflows into Testable Trade Hypotheses
BTC ETF inflows paired with Ether fund outflows create a measurable market-flow signal. The challenge is operational: turn that headline into a repeatable rule you can test objectively. This guide walks you from headline to hypothesis, to measurable entry/exit rules, to recording outcomes. Use the included template and checklist to run consistent experiments.
## Why frame macro/product flows as testable hypotheses
News that "Bitcoin ETF inflows return while Ether funds slip into outflows" is an observation, not a trading rule. Traders who act on flows without a consistent framework will struggle to know whether the signal actually works, or if results were luck or context-dependent.
A testable hypothesis makes your assumptions explicit: what exactly triggers a trade, how much you size, when you exit, and how you record the result. That lets you accumulate evidence and iterate.
## Step 1 — Turn the headline into a clear hypothesis
Start by writing a single terse hypothesis in the form: "If [signal], then [expected directional price response] over [timeframe]."
Example:
- Hypothesis: "If 3-day net BTC ETF inflows > $200M while ETH fund flows show 3-day net outflows < -$50M, then BTC will outperform ETH over the next 5 trading days."
This makes the signal, thresholds, and timeframe explicit.
## Step 2 — Define measurable signal inputs and thresholds
Make every part measurable and sourceable.
- Signal sources: specify which fund-flow data provider(s) or aggregate you use.
- Window: define the aggregation window (e.g., 3-day net flows, 24-hour flow spike).
- Thresholds: pick numbers justified by historical distribution (e.g., top 10% of inflow days) or fixed amounts.
- Cross-filters: add context filters like "BTC price above 50-day MA" or "ETH implied volatility < X" if you want.
If you don't have direct flow data, you can use proxies (on-chain inflows/outflows to custodial wallets, ETF AUM changes). Document the proxy and its limitations.
## Step 3 — Translate into entry, exit and timeframe rules
Write explicit trade rules so they can be executed or simulated without ambiguity.
- Entry rule: e.g., "When the signal condition is met at 10:00 UTC, allocate 20% of portfolio risk budget to increase BTC allocation by 10 percentage points, funded by reducing ETH allocation by the same amount."
- Stop / risk control: e.g., "If BTC moves against the position by 4% from entry, reduce position by half; full exit at 8% adverse move." Avoid guaranteed statements—these are risk rules.
- Exit rule: two options—time-based or condition-based. Example: "Exit after 5 trading days or when BTC/ETH relative performance gap narrows to <0.5%."
- Sizing: define percent of portfolio or notional and how to scale with volatility.
## Step 4 — Create a results logging template (use this)
Use a consistent journal to capture signal context and outcomes. Here's a compact template you can copy into a spreadsheet or journal tool.
ETF flows → trade hypothesis template
- Hypothesis ID: H-YYYYMMDD-01
- Signal date/time: YYYY-MM-DD HH:MM UTC
- Signal values: BTC ETF 3d net inflows = $___; ETH 3d net flows = $___
- Entry rule triggered: Yes / No
- Entry timestamp & prices: BTC ____, ETH ____
- Position sizing: BTC +____%, ETH -____%
- Stop / risk actions taken: notes
- Exit timestamp & prices: BTC ____, ETH ____
- P&L (absolute / %): BTC ____, ETH ____
- Notes / market context (news, volatility, macro): short text
- Outcome classification: Success / Partial / Failed / Inconclusive
Keeping each field consistent lets you aggregate results later.
## Step 5 — Run the experiment and avoid common pitfalls
- Run multiple trials: one or two trades don’t prove anything. Aim for a minimum number of observations (e.g., 10+ triggers) before drawing conclusions, understanding the result will vary by market regime.
- Maintain version control: if you change thresholds or timeframes, treat the new rule as a new hypothesis ID.
- Mind survivorship and selection bias: record every trigger, including those you ignored.
- Control for confounders: major macro events or exchange outages can swamp the signal.
## Practical example (numbers for clarity)
1. Hypothesis: 3-day BTC inflows > $150M and 3-day ETH outflows < -$30M → BTC outperforms ETH over 5 days.
2. Entry: On signal day at 09:00 UTC, increase BTC allocation by 8% funded from ETH; size capped at 2% portfolio risk.
3. Exit: Close swap after 5 calendar days, or earlier if BTC declines 6% from entry.
4. Log results in the template above.
Run this rule across your historical signal data to see how many triggers occurred and what the average BTC/ETH relative return was after 5 days.
## Step 6 — Compare outcomes and iterate
After collecting results, compute simple metrics per hypothesis: win rate, average return, median return, max drawdown during the trade window, and average holding time. Compare different hypotheses side-by-side (e.g., 3-day vs. 7-day windows, different thresholds).
Use the comparison to: tighten thresholds, change timeframes, or combine signals (flows + volatility filter).
## Demo checklist: quick experiment setup
- [ ] Define a single hypothesis statement.
- [ ] Choose flow data source and record last 12 months for context.
- [ ] Set clear entry, exit, stop and sizing rules.
- [ ] Create a results log (use the template above).
- [ ] Backtest or manually review historical triggers for at least 10 samples.
- [ ] Run live tracking for the next 30–90 days and record every trigger.
- [ ] Review aggregated outcomes and iterate.
## Conclusion
ETF inflows into BTC and outflows from ETH can be a useful signal class, but only when treated as repeatable experiments. Make your hypotheses measurable, log every event, and compare outcomes over multiple triggers and market regimes. With a consistent template and discipline, you’ll turn headlines into evidence-based decisions and know whether a flow signal deserves a place in your toolkit.
If you want a place to document, monitor and compare hypotheses and their historical results, consider saving your templates and logs in Trade Strategy: https://trade-strategy.com/blog
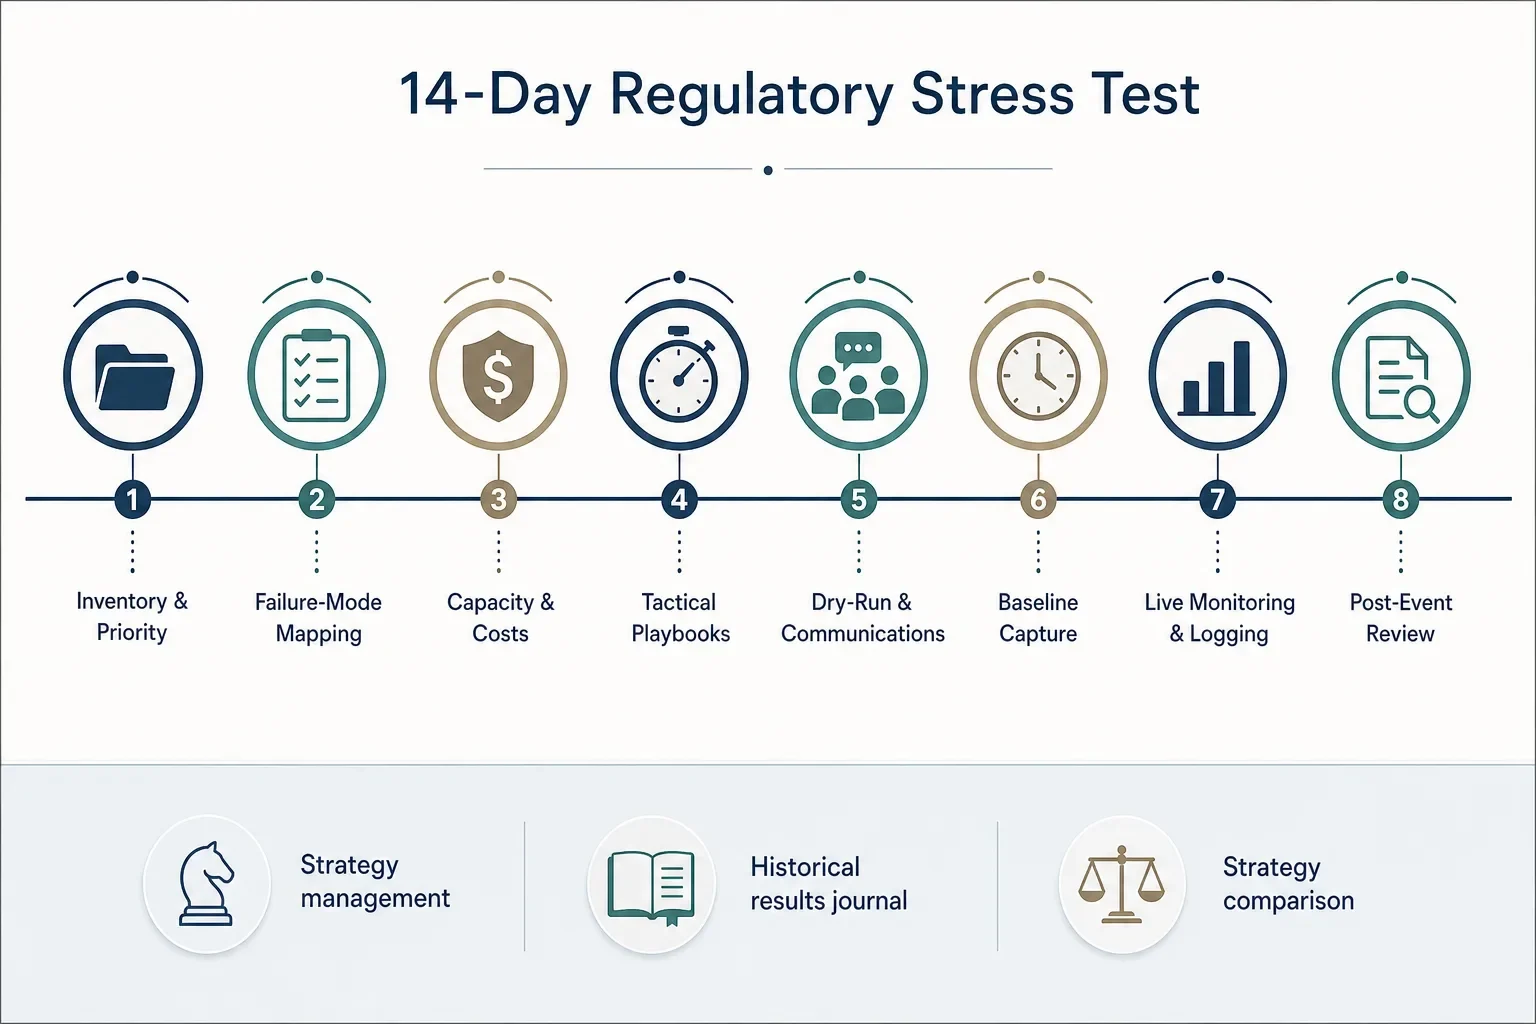 2026-07-30
How to Stress‑Test Your Crypto Strategies Before a Regulatory Deadline
Practical step‑by‑step checklist and templates to stress‑test crypto strategies ahead of a regulatory deadline. Document rules, log pre/post results and compare adaptations using Trade Strategy’s released features.
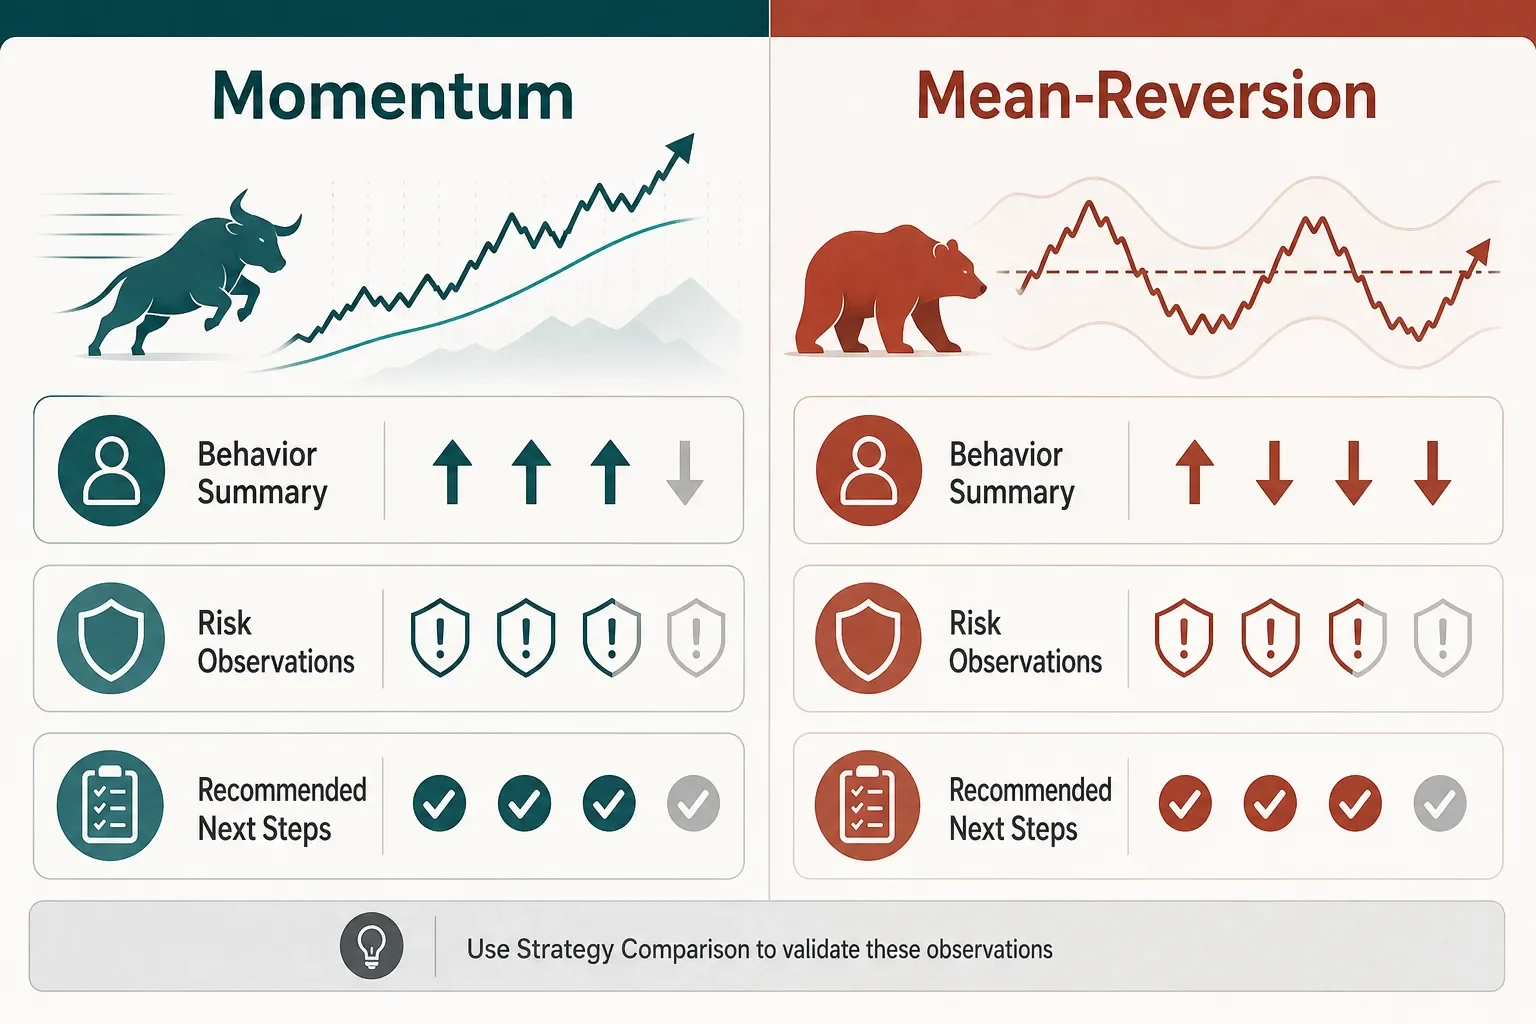 2026-08-11
When Markets Decouple: A Trader’s Checklist for Post‑Event Strategy Reviews
A step‑by‑step playbook for post‑event reviews: capture hypotheses, tag trades by catalyst, log outcomes, and use Strategy Comparison to see what held up during the Korea chip crash vs. Bitcoin rally.
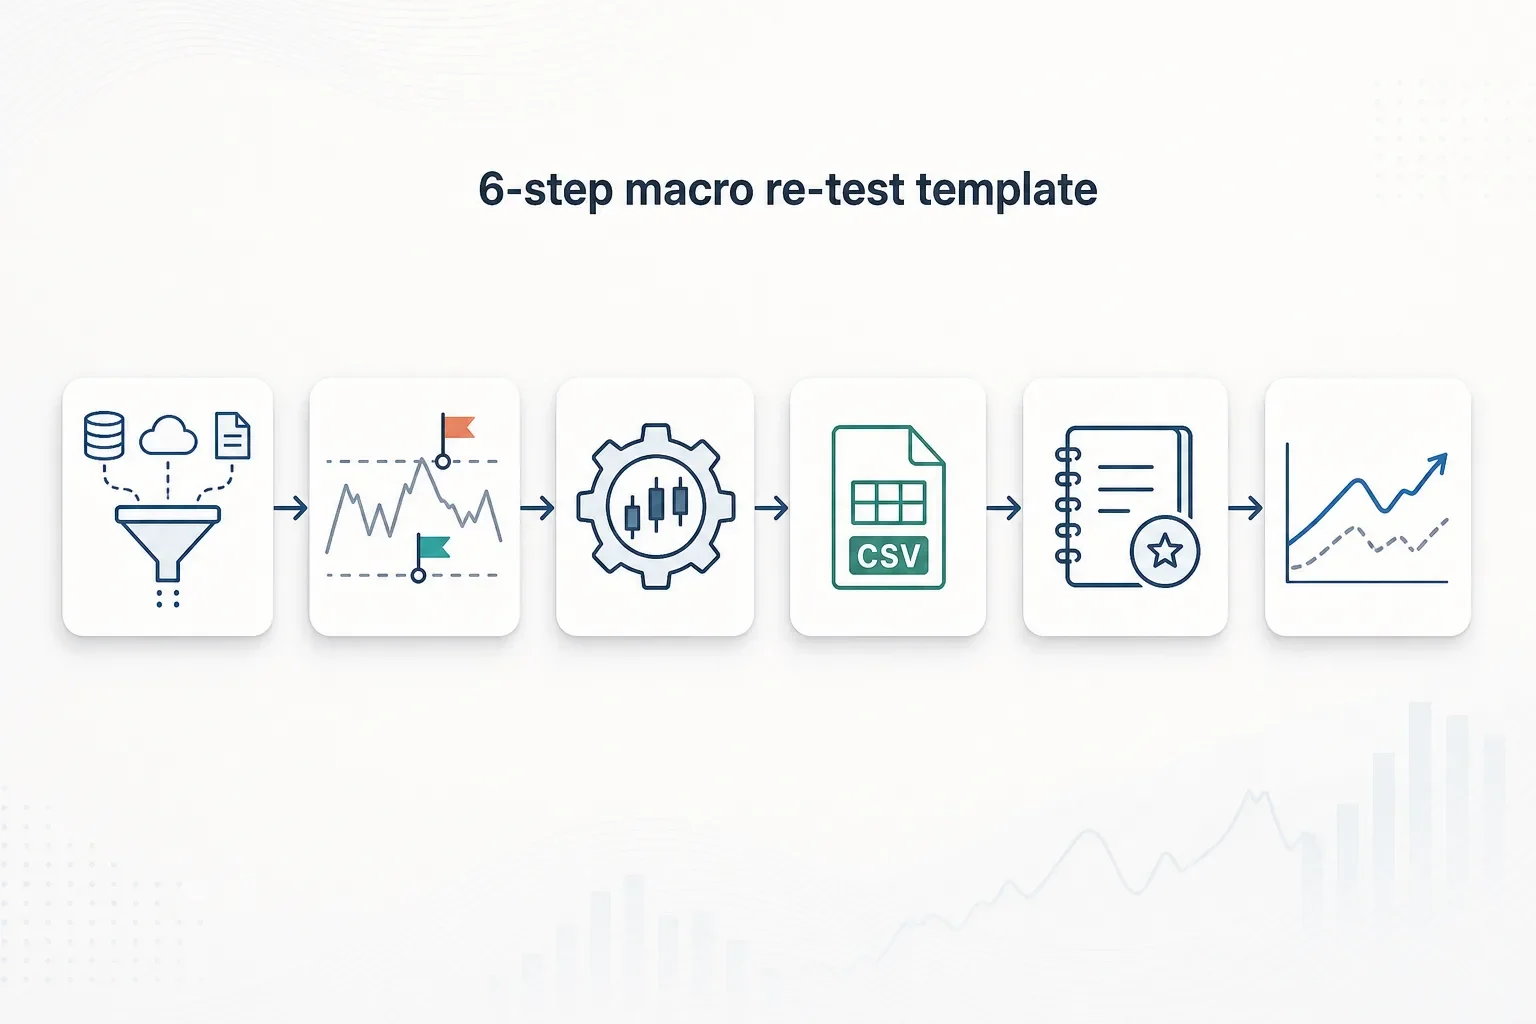 2026-08-11
How to Backtest Crypto Strategies Against Rising Rates and Oil Shocks — A Practical Template
A hands-on template for re-testing crypto strategies when rates and oil spike: ingest macro time series, run variant backtests, record results in Trade Strategy, and compare outcomes to adapt sizing rules.