
How to test and document BTC vs Gold hedges when dollar‑devaluation risk rises
A step‑by‑step workflow to test and document BTC vs gold hedges when dollar‑devaluation risk rises: define hypotheses, build templates, log outcomes, tag regimes and compare results using repeatable CSV templates and a checklist.

# How to test and document BTC vs Gold hedges when dollar‑devaluation risk rises
Rising U.S. debt and talk of dollar devaluation change the backdrop for portfolios. For active traders and portfolio managers that means correlations can shift, flows into safe‑haven assets can spike, and previously reliable hedges may behave differently. This guide gives a reproducible, evidence‑first workflow to test BTC vs gold hedge ideas, document assumptions and outcomes, and make repeatable decisions when macro regimes shift.
## Quick overview: objectives and deliverables
- Objective: Build an auditable experiment that answers “Which hedge—BTC or gold—protects my portfolio under dollar‑devaluation scenarios?”
- Deliverables: strategy template (metadata + rules), trade/result log (CSV‑ready), tagged macro periods, and a comparison checklist to evaluate outcomes.
## Step 1 — Define hypotheses and scenario tags
Start with clear, testable hypotheses. Example formats:
- H1: "A 2% portfolio allocation to BTC reduces peak‑to‑trough loss during short, sharp dollar‑devaluation events compared with no hedge."
- H2: "A 2% allocation to physical gold reduces overnight gap exposure relative to BTC during prolonged dollar weakness periods."
Create scenario tags you can apply to time windows and trades. Keep tags short and consistent: Dollar‑Devaluation, High‑Inflation, Fed‑Liquidity, Risk‑Off‑Flow. These tags let you slice results later by regime.
Checklist at this stage:
- Document assumptions (liquidity, trade size, slippage, tax treatment).
- Set the exact time windows for scenario testing (e.g., start/end dates or event triggers).
- Choose instruments and execution methods (spot, futures, ETFs, options).
## Step 2 — Build reproducible strategy templates
For each hedge idea, record a structured strategy definition so tests are repeatable. Essential fields:
- Strategy name
- Instrument (BTC spot, XAU spot, GLD ETF, BTC futures)
- Entry rule (calendar date, indicator threshold, macro trigger)
- Exit rule (timebound, signal, stop loss)
- Position sizing and rebalancing rules
- Assumptions (liquidity, max slippage, borrowing costs)
Example CSV header for a strategy template:
strategy_name,instrument,entry_rule,exit_rule,position_size,assumptions,notes
You can use this template to create multiple strategy variants (static allocation, volatility‑targeted allocation, options collar, etc.). Keep rule text precise so another trader or future you can follow it exactly.
## Step 3 — Log trades and outcomes (the historical results journal)
A rigorous trade log is the backbone of evidence. Capture each execution and outcome with enough detail to reproduce P&L calculations.
Essential trade log columns:
date,time,instrument,side,size,price,fee,slippage,realized_pnl,unrealized_pnl,tag,notes
Tag every trade with the scenario tags from Step 1 and note liquidity conditions and execution venue. Track both realized and mark‑to‑market unrealized P&L so you can analyze drawdown behavior during regime windows.
## Step 4 — Compare strategies across the same windows
When you have strategy definitions and trade logs, compare outcomes across identical time windows and tags. Key comparison metrics:
- Peak‑to‑trough drawdown during the tagged regime
- Time to recovery (days/hours until portfolio back to pre‑event equity)
- Realized volatility while the hedge was active
- Correlation of hedge instrument to base portfolio during the window
- Liquidity and execution cost observed (fees + slippage)
- Tail outcomes (number/size of extreme losses)
Practical comparison approach:
1. Select a tagged regime (e.g., Dollar‑Devaluation: 202X‑MM to 202Y‑MM).
2. Filter trade logs to that window for each hedge strategy.
3. Compute the metrics above and produce a side‑by‑side table.
4. Look beyond averages—inspect individual large moves and execution notes to understand why a hedge failed or succeeded.
An anonymized example: A discretionary manager tested two simple hedges during a dollar‑weakness window—(A) a fixed BTC allocation and (B) a fixed gold allocation. The log showed that BTC provided faster intra‑day recovery during sharp risk‑on/risk‑off reversals but had larger realized intraday drawdowns and higher trading costs in thin liquidity periods. Gold produced steadier overnight protection with fewer execution issues but lagged on rapid dollar reversals. The manager used those qualitative findings plus the metrics above to decide when each hedge type should be used in the playbook (e.g., BTC for intraday shock coverage; gold for overnight/carry protection).
## Backtest and live‑test checklist
- Use identical windows and tagging for each strategy.
- Include realistic execution assumptions (slippage, fees, borrow costs).
- Run sensitivity checks: vary position size, execution delay, and slippage.
- Inspect worst N trades and annotate causes (liquidity, margin, platform issues).
- Keep change logs: every time you alter a strategy’s rule, record the reason and the expected effect.
## CSV import templates (quick reference)
Strategy template header:
strategy_name,instrument,entry_rule,exit_rule,position_size,assumptions,notes
Trade log header:
date,time,instrument,side,size,price,fee,slippage,realized_pnl,unrealized_pnl,tag,notes
Use consistent date formats (ISO: YYYY-MM-DD) and standard instrument tickers to simplify analysis across tools.
## Decision framework: what to prioritize
When deciding which hedge to adopt, weigh these operational factors alongside performance metrics:
- Liquidity constraints and maximum allocatable size
- Execution costs during stress
- Tax and custody implications (crypto vs physical metals)
- Correlation behavior under different stress types
- Capacity to scale the hedge without moving markets
Use the evidence you logged to set clear conditional rules (e.g., “Use BTC hedge for intraday protection when implied volatility > X and onshore liquidity above threshold; use gold for overnight exposures.”)
## Product and roadmap note
Trade Strategy supports creating and organizing trading strategies, recording historical strategy results in a results journal, and comparing strategies using saved information and historical results. The product roadmap also includes probabilistic AI direction suggestions and AI‑assisted BTC market analysis as decision‑support capabilities; these are intended to augment disciplined hypothesis testing and documented experiments, not to provide certainty or personalized financial advice.
## Conclusion
When dollar‑devaluation risk rises, the answer to “BTC or gold?” depends on the precise hedge objective, execution constraints and the evidence you collect. The reproducible workflow above—define hypotheses, codify strategies, log outcomes with scenario tags, and compare metrics across identical windows—turns intuition into testable results. Use the CSV templates and checklists here to run your first round of experiments and build an auditable record that informs repeatable decisions.
CTA: Document and compare your BTC vs gold hedge tests with a structured strategy template and results journal to turn ideas into evidence. Learn more at https://trade-strategy.com/blog
 2026-08-11
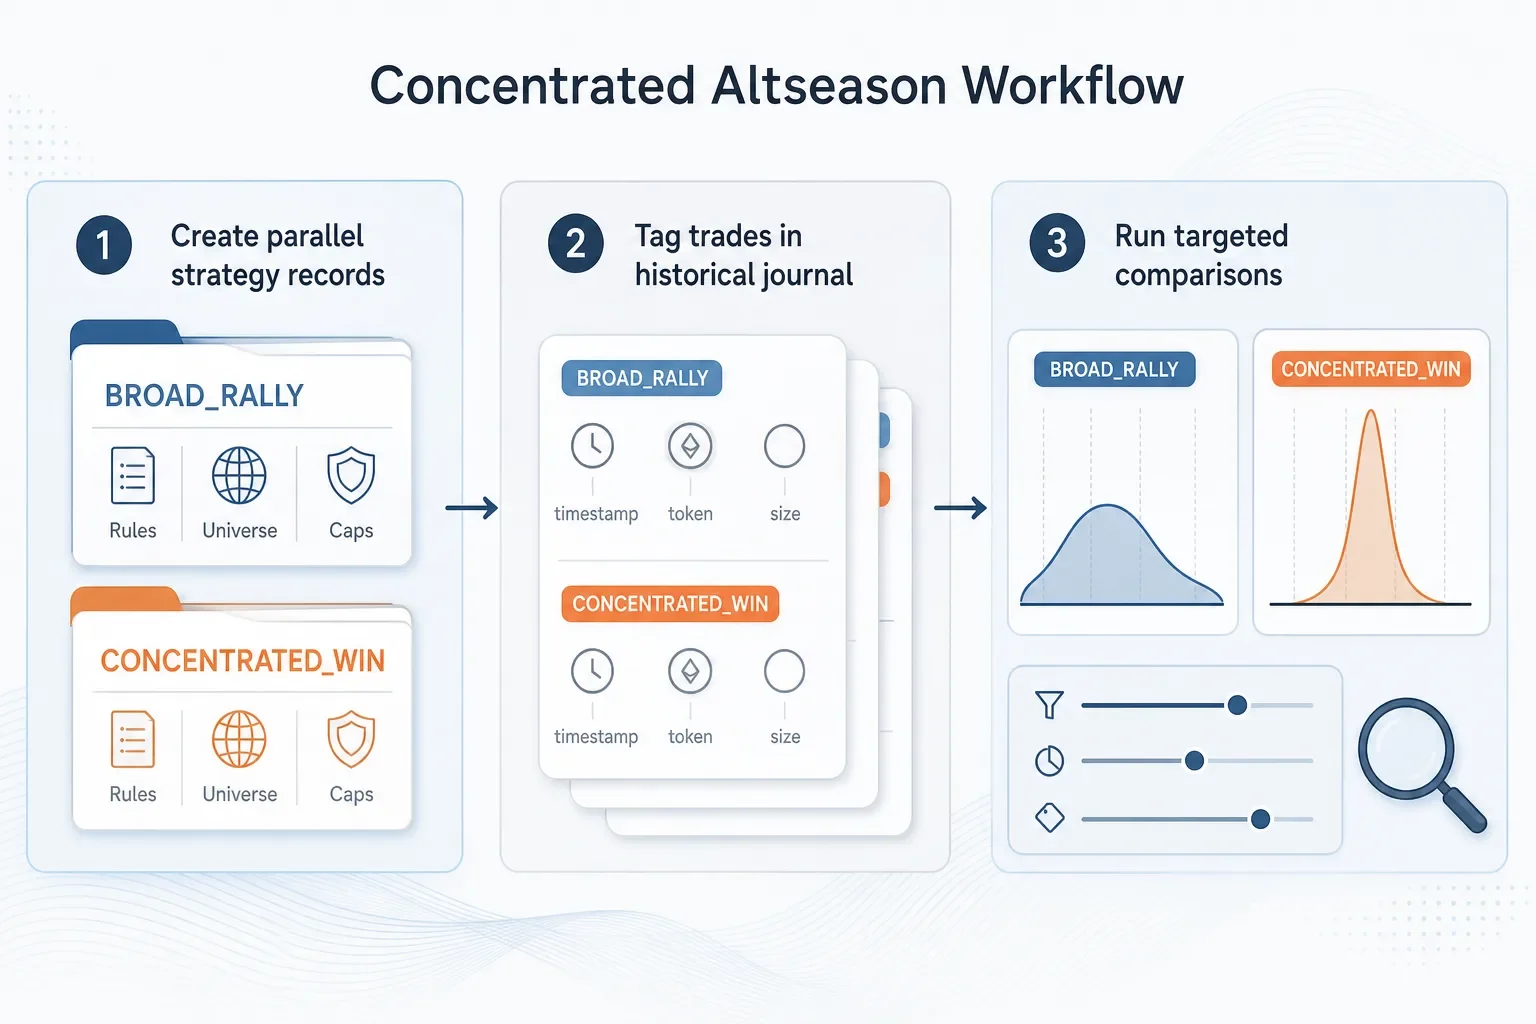
How to Adapt Your Strategies for a More Concentrated Altseason
Step-by-step workflow to adapt trading strategies for a concentrated altseason: create regime-specific strategy records, tag outcomes in a historical journal, compare results across token subsets, and apply concentration-aware sizing and monitoring.
 2026-08-11
Miner Stress Testing for BTC Strategies: A Reproducible Case Study & Template
A forensic primer on turning a ~14% Bitcoin difficulty drop into testable strategy rules. Learn which miner metrics to track, how to encode stress variants (sizing, stops, filters) and how to record reproducible case studies in Trade Strategy.
 2026-08-11
How to Treat Bitcoin ETF Inflows as a Testable Trading Signal (with a Trade Strategy template)
Turn Bitcoin ETF inflows into a repeatable experiment: source flows, design falsifiable hypotheses, backtest with realistic costs, and use Trade Strategy to document and compare results. Includes a downloadable experiment template.