
How to Stress‑Test Crypto Strategies for Institutional Sell‑Offs (When BTC Hits a Resistance Wall)
A practical, step‑by‑step checklist to stress‑test crypto strategies when BTC stalls at a resistance level amid institutional tech sell‑offs. Document assumptions, tag event trades, compare baseline vs stress metrics, and set slippage/drawdown rules.

# How to Stress‑Test Crypto Strategies for Institutional Sell‑Offs (When BTC Hits a Resistance Wall)
BTC hits a $65K resistance wall while tech stocks dump — a classic regime-shift scenario that exposes strategies to correlation breakdowns, sudden slippage and deeper drawdowns. This guide gives a reproducible checklist and templates you can use to evaluate whether your strategies survive that shock and where to harden them.
Use Trade Strategy's Strategy Management, Historical Results Journal and Strategy Comparison to document assumptions, record historical results and compare strategy performance across event windows. This article focuses on practical steps you can run today and reproducible templates you can store in your strategy records.
## Why this scenario matters for strategy robustness
When a major asset like Bitcoin stalls near a resistance level and institutional flows hit risk assets, several risk channels open:
- Volatility spikes and intraday gaps increase realized slippage.
- Cross‑asset correlations can rise or invert; strategies that assumed low correlation may see concentrated losses.
- Liquidity at the top of the book thins, moving market impact higher than normal.
The goal of a stress test is not to predict direction but to understand how these channels affect your rules, position sizing and risk limits so you can set defensible thresholds and contingency rules.
## Quick overview: the reproducible workflow
1. Document strategy assumptions and invariant risk rules.
2. Import or record recent trade and backtest results into your Historical Results Journal and tag the event window.
3. Define baseline and stress windows and extract comparable metrics.
4. Measure realized slippage and drawdown against thresholds; record findings in a structured report.
5. Use Strategy Comparison to see which approaches held up and why.
6. Create/update execution and risk rules (slippage triggers, max intraday drawdown, stop-out logic).
Below are step‑by‑step actions, checklist items, and reporting templates you can copy into your process or store in Trade Strategy records.
## Step 1 — Document assumptions (why the strategy should work)
Create a strategy record and capture these fields before judging performance. This preserves your ex‑ante view and makes post‑mortem interpretation reproducible.
Required fields (template):
- Strategy name
- Date created / analyst
- Timeframes traded (e.g., 1m, 1h, daily)
- Liquidity assumptions (min avg daily volume, acceptable order book depth)
- Correlation assumptions (e.g., low correlation to equities)
- Slippage model used (per-lot or % of price)
- Max acceptable drawdown and recovery horizon
- Execution method (maker/taker, limit/market) — note: Trade Strategy does not execute orders
Record these in your Strategy Management entry so they're permanently associated with results.
## Step 2 — Ingest recent results and tag the event
Collect trade logs and backtest runs that cover the sell‑off window and import or enter them into the Historical Results Journal. For each result entry, add an event tag (e.g., "BTC-65K-TECH-SELLOFF-2026-07-XX").
Minimal result fields (template):
- Timestamp
- Instrument (BTC-USD)
- Side (long/short)
- Executed price and notional
- Planned price (expected execution)
- Slippage realized (executed - planned)
- P&L per trade
- Position size
- Fees
- Trade comment (market conditions, order type)
Tagging trades and backtests with the event label lets you extract only the trades that occurred during the stressed period for apples‑to‑apples comparison.
## Step 3 — Define baseline vs stress windows and metrics
Choose a reasonable baseline window (e.g., previous 30 trading days) and the stress window (the day(s) around the resistance test and institutional sell‑off). For each strategy, compute:
- Net P&L
- Max drawdown during window
- Percent of trades with slippage > baseline average
- Average realized slippage per trade
- Win rate and average R per trade
- Time‑to‑recovery after largest drawdown
Keep formulas simple and reproducible: baseline average slippage = mean(slippage) over baseline window; stress multiplier = stress average / baseline average.
## Step 4 — Compare strategies and identify failure modes
Use a structured comparison table to surface why a strategy failed or survived. Key columns:
- Strategy name
- Net P&L (stress window)
- Max drawdown (%)
- Avg slippage ($ or %)
- Position sizing behavior (fixed vs volatility‑scaled)
- Correlation exposure note
- Execution risk (market orders vs limit orders)
- Primary failure mode (liquidity, correlation, leverage/mis‑sizing)
Trade Strategy's Strategy Comparison feature is designed for this: by comparing recorded results and saved strategy metadata you can quickly spot patterns across strategies and time windows.
## Step 5 — Set actionable thresholds and rules
Translate findings into concrete rules you can test or encode in risk checks.
Suggested rule templates:
- Slippage trigger: If realized slippage > 2x baseline average for 2 consecutive days, switch to limit orders or reduce size by 50%.
- Intraday drawdown cap: If unrealized loss > X% of NAV during stress window, reduce new position openings by Y%.
- Correlation alert: If correlation with equity basket increases by Z points vs baseline, lower leverage on cross‑asset signals.
Document these rules in the Strategy Management record so they are discoverable during future reviews.
## Practical example: checking two strategies across the sell‑off
1. Create Strategy A (momentum, 1h) and Strategy B (mean‑reversion, 15m) in your strategy registry.
2. Import trades/backtests and tag the sell‑off window.
3. Pull metrics for baseline and stress windows for both strategies.
4. Compare: you might find Strategy A's drawdown doubled due to larger position sizing rules, while Strategy B's frequent small trades experienced outsized slippage.
5. Update Strategy A to include a volatility‑scaled size limiter; update Strategy B to prefer limit orders during low-liquidity hours. Re‑record results in the Historical Results Journal when re‑tested.
This reproducible loop — document, test, compare, rule — is the most robust way to reduce surprise during cross‑asset shock events.
## Post‑mortem reporting fields (copy into your report)
- Event tag
- Summary of market conditions (BTC price range, known liquidity events, equity sell‑off notes)
- Strategies tested
- Key metrics baseline vs stress
- Principal failure modes
- Recommended short‑term fixes
- Recommended longer‑term changes to rules/assumptions
- Follow‑up tests planned
Store the report alongside the strategy records and historical results so future reviewers can trace decisions to data.
## Roadmap note (planned features)
Trade Strategy plans AI‑assisted BTC market analysis as part of the product roadmap. The planned feature aims to summarize multi‑timeframe market structure and help identify regime shifts; any AI output would be presented as probabilistic decision support rather than certainty.
## Conclusion
Institutional sell‑offs that coincide with BTC testing a resistance wall are stressful but testable events. Apply a reproducible checklist: record assumptions, ingest and tag results, compare baseline vs stress metrics, and convert findings into concrete execution and risk rules. Use Strategy Management, the Historical Results Journal and Strategy Comparison to keep your process auditable and repeatable.
Read the full checklist and walkthrough on our blog: https://trade-strategy.com/blog
 2026-08-11
How to run an event-driven post‑mortem for your BTC strategy (step‑by‑step)
A step‑by‑step workflow for BTC event‑driven post‑mortems: record rules, log trades, compare pre/event/post windows using Trade Strategy to identify rule breakpoints and create testable updates.
 2026-08-11
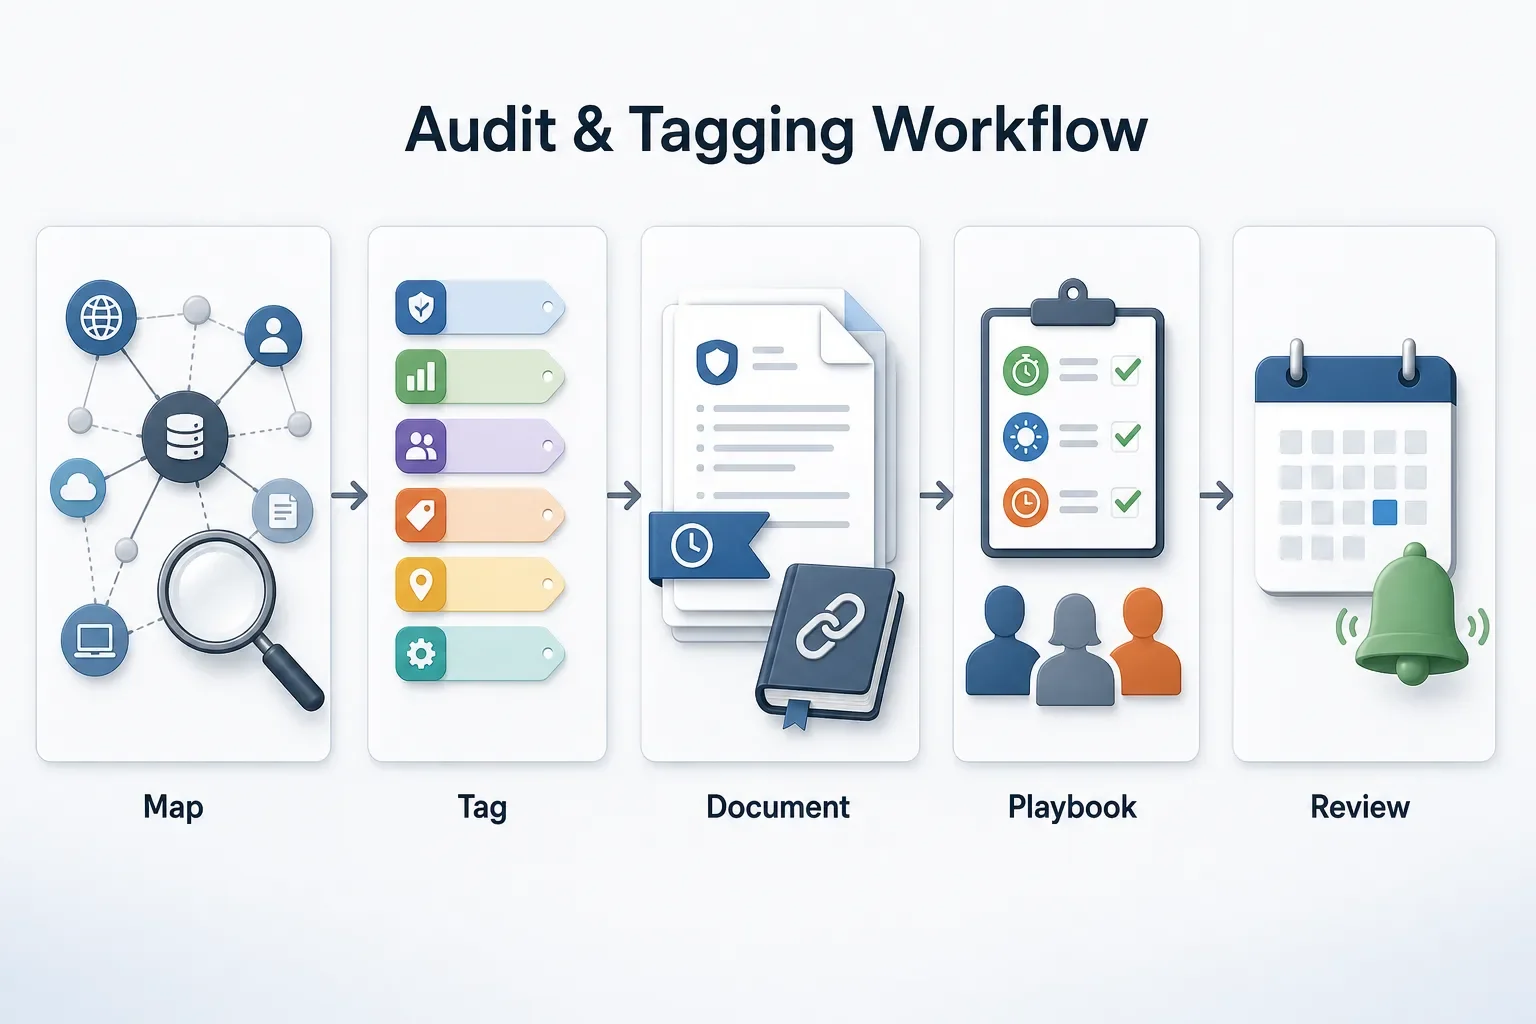
How to Audit and Tag DeFi Strategies for Regulatory Exposure
Practical, step‑by‑step workflow to map DeFi protocol touchpoints, tag regulatory exposure, preserve audit trails with documented rules and historical results, and prepare playbooks to respond quickly to enforcement events.
 2026-08-11
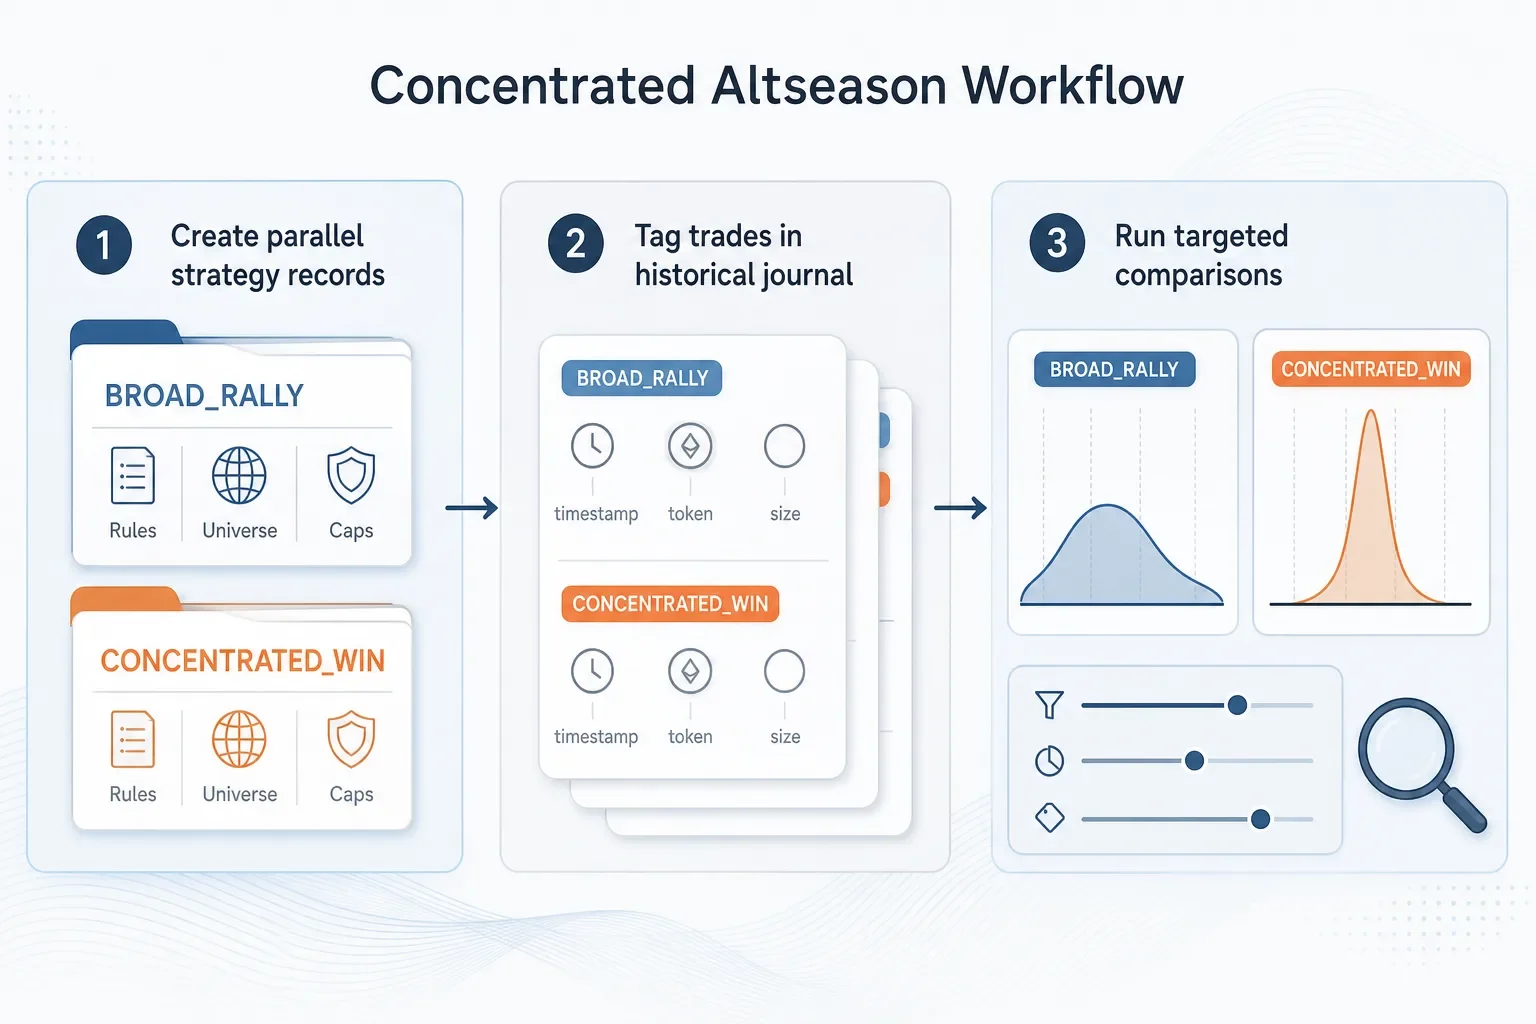
How to Adapt Your Strategies for a More Concentrated Altseason
Step-by-step workflow to adapt trading strategies for a concentrated altseason: create regime-specific strategy records, tag outcomes in a historical journal, compare results across token subsets, and apply concentration-aware sizing and monitoring.